
Table of contents
- The worst way to find out your app is broken
- What performance monitoring actually tracks
- The four metrics that matter most to a founder
- Uptime: is your app actually available?
- Response time: how long are users waiting?
- Error rate: how often is something going wrong?
- Database query time: where is the slowdown hiding?
- How to read your BaaS monitoring dashboard without a degree
- Setting up alerts so the dashboard watches itself
- Making monitoring a business habit, not a developer task
The worst way to find out your app is down is from an angry tweet. The second worst way is a support ticket that opens with “this has been broken since yesterday.” By the time a user takes the time to tell you something is wrong, they have already absorbed the frustration, already formed an opinion about your product’s reliability, and in many cases already started evaluating alternatives. Performance monitoring exists so that you find out first.
For first-time founders, monitoring can feel like something to set up “later” — after the launch, after the first hundred users, after things settle down. The problem is that things rarely settle down, and the cost of finding problems reactively grows with every user you add. A ten-minute setup today is the difference between catching a database slowdown at two in the afternoon and hearing about it from your biggest customer at two in the morning.
The worst way to find out your app is broken
There is a pattern that repeats itself across early-stage SaaS companies with uncomfortable regularity. The founder is heads-down on a new feature, the team is focused on a sales conversation, and somewhere in the infrastructure a query starts timing out or an authentication service starts returning errors. Users hit the problem, most of them silently close the tab, and a small percentage fire off a frustrated message.
The founder sees the message hours later, scrambles to investigate, discovers the issue has been running for several hours, and spends the next day doing damage control with affected users. The technical fix might take twenty minutes. The trust repair takes considerably longer.
What makes this pattern so common is not negligence — it is the absence of a system. Without monitoring, the only people who know your app is struggling are the users experiencing it. With monitoring, your infrastructure reports its own health continuously, and you get notified the moment something crosses a threshold you care about. The shift from reactive to proactive is not a matter of technical sophistication. It is a matter of having the right setup in place.
What performance monitoring actually tracks
Performance monitoring is the practice of continuously measuring how your app is behaving and storing that data so you can spot patterns, catch anomalies, and investigate problems with context rather than guesswork.
At its core, monitoring answers four questions on an ongoing basis: is the app available, how fast is it responding, how often is it failing, and where are the slowdowns concentrated. Each of these questions maps to a specific metric, and each metric tells a different part of the story. Understanding what each one means in plain business terms is more useful than understanding the technical mechanics behind how it is measured.
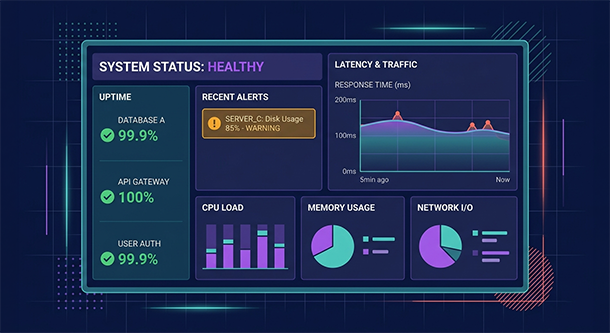
Think of it like the instrument panel in a car. You do not need to understand combustion engineering to know that a red temperature gauge means pull over immediately. You need to understand what the gauges mean and what the normal range looks like so you can recognize when something is wrong. A monitoring dashboard is the instrument panel for your app.
The important distinction for founders is between monitoring and logging. Logs are detailed records of everything that happened, useful for post-incident investigation. Monitoring is the real-time signal that tells you something is happening right now. Both have their place, but monitoring is the layer that protects your users in real time.
The four metrics that matter most to a founder
Uptime: is your app actually available?
Uptime is the percentage of time your app is accessible and functional. A 99.9% uptime sounds excellent until you do the math: that remaining 0.1% translates to roughly eight and a half hours of downtime per year. For a B2B SaaS product used during business hours, that could mean multiple incidents that affect paying customers during their working day.
Most BaaS platforms publish their own infrastructure uptime figures, typically in the range of 99.9% to 99.99%. But your app’s effective uptime depends on more than just the platform — it also depends on how your application code handles edge cases, how your dependencies behave, and how quickly problems are detected and resolved. Monitoring your own uptime separately from your platform’s published figures gives you the most accurate picture of what your users are actually experiencing.
Response time: how long are users waiting?
Response time measures how long it takes your app to answer a request — from the moment a user clicks a button or loads a page to the moment the result arrives. This metric is arguably the one most directly connected to user satisfaction. Research across consumer and B2B software consistently shows that users perceive applications as “fast” when responses arrive in under one second and begin to disengage when waits extend beyond three seconds.
Tracking response time over time reveals patterns that a single measurement misses. An app that responds in 400 milliseconds on a quiet Tuesday morning but takes 2.8 seconds during a Monday morning peak has a scaling problem that only shows up under load. Monitoring captures that pattern so you can address it before it becomes a regular user experience failure.
Error rate: how often is something going wrong?
Error rate tracks the percentage of requests that result in a failure rather than a successful response. A small baseline error rate is normal in any application — network hiccups, occasional timeouts, edge cases in user input. What matters is the trend. A sudden spike in error rate, even if the absolute number is still low, almost always signals that something specific has broken or degraded.
For founders, the most useful way to think about error rate is in terms of affected users rather than abstract percentages. A 2% error rate on a product with 5,000 daily active users means roughly 100 users hitting failures every day. Framed that way, a metric that looks minor on a dashboard becomes a concrete customer experience problem worth addressing urgently.
Database query time: where is the slowdown hiding?
As covered in the context of database optimization for startups, slow database queries are one of the most common sources of app performance degradation as a product scales. Query time monitoring tracks how long individual database operations are taking and flags the ones that are consistently slow or have recently gotten slower.
This metric is particularly valuable because it isolates the source of a problem. If your overall response time increases but your query times are stable, the issue is likely in your application layer or network. If query times spike, you know immediately where to focus. That specificity saves hours of investigative work during an incident.
[IMAGE PLACEHOLDER 2: Flat design infographic showing four dashboard panels in a two-by-two grid layout, each representing one metric: uptime percentage with a green indicator, response time line graph, error rate bar chart with a spike highlighted in amber, and database query time trend. Clean teal and coral on light gray. No people. Editorial infographic style.]
How to read your BaaS monitoring dashboard without a degree
Every major BaaS platform includes some level of built-in monitoring. Supabase surfaces database performance metrics, API response times, and error logs directly in its dashboard. Firebase includes performance monitoring tools that track app responsiveness across different device types and geographies. The specifics vary by platform, but the core information is broadly consistent.
When you open your monitoring dashboard for the first time, resist the instinct to try to understand every number simultaneously. Start with three things: the current uptime status, the response time trend over the past seven days, and the error rate over the same period. These three data points give you a baseline understanding of whether your app is healthy, improving, or degrading.
From that baseline, you can begin to notice patterns. Does response time climb every weekday morning? That suggests a load issue tied to peak usage. Does error rate spike on specific days? That might correlate with a scheduled job, a third-party integration, or a deployment. The dashboard does not interpret these patterns for you, but it gives you the data to connect the dots with context you already have from running the product.
The goal is not to become fluent in every metric your platform exposes. It is to develop enough familiarity with your app’s normal behavior that abnormalities stand out clearly, even to a non-technical eye.
Setting up alerts so the dashboard watches itself
A monitoring dashboard you have to remember to check is only marginally better than no monitoring at all. The real leverage comes from configuring alerts that notify you automatically when a metric crosses a threshold that warrants attention.
Most BaaS platforms allow you to set alert thresholds for key metrics and deliver notifications via email, Slack, or SMS. Setting these up takes less than fifteen minutes and fundamentally changes your relationship with your app’s health. Instead of periodically checking in on a dashboard, you operate with confidence that if something goes wrong, you will hear about it before your users do.
A practical starting point for alert thresholds: notify when uptime drops below 99.5% in any rolling hour, when average response time exceeds two seconds over a five-minute window, and when error rate exceeds 1% over the same window. These are conservative thresholds that will catch genuine problems without generating noise from routine fluctuations. Adjust them as you develop a clearer sense of your app’s normal operating range.
Making monitoring a business habit, not a developer task
The most important reframe for non-technical founders is that performance monitoring is not a developer responsibility that occasionally produces reports for the business. It is a business function that happens to involve technical metrics. Your app’s reliability is a product feature. Your response time is part of your user experience. Your error rate is a measure of how often you are failing your customers.
Treating monitoring as a business habit means reviewing your key metrics as part of your regular operational rhythm — not just when something seems wrong. A five-minute weekly review of your monitoring dashboard, alongside your revenue and support metrics, keeps you connected to your product’s health in a way that prevents the slow degradation most founders only notice when it has already done damage.
As your user base grows and the stakes around reliability increase, the monitoring habits you build early become the foundation for more sophisticated observability practices. Understanding how performance connects to the broader challenge of handling growth puts this squarely in the territory of app scalability for startups, where reliability and speed are two sides of the same coin.
About the Author

AISalah
Bridges linguistics and technology at PointOfSaaS, exploring AI applications in business software. English Studies BA with hands-on back-end and ERP development experience.
Did you find this helpful?
Your feedback helps us curate better content for the community.