
Most small business owners evaluate their SaaS tools the way they evaluate most things when time is short by feel. Does it seem like things are more organized? Does the team seem less frustrated? Are clients asking fewer follow up questions? Those impressions are not useless. They are also not reliable enough to make good decisions about a stack that costs real money every month and is supposed to be changing how the business fundamentally operates.
Feel-based evaluation keeps underperforming tools in the stack long past the point where measurement would have justified replacing or restructuring them. It also keeps founders from recognizing when a tool is genuinely working because without a baseline and a trend the improvement that has happened over six months is invisible.
The five metrics below require no data team, no analytics infrastructure and no software beyond what is probably already in the stack. They are observable through normal management activity and collectively they tell the truth about whether the SaaS investment is delivering operational leverage or consuming budget without proportionally changing how the business works.
Why subjective evaluation fails
Before the metrics it is worth being direct about why subjective evaluation produces unreliable results because understanding the failure mode makes the alternative more compelling.
Subjective evaluation is anchored to recent experience. If the last two weeks have felt unusually chaotic the whole stack feels ineffective even if the tools have improved coordination significantly over the past six months. If the last two weeks have felt unusually smooth the tools get credit even if the improvement had nothing to do with the software.
Subjective evaluation is also heavily influenced by the loudest voices. One team member who consistently finds a tool frustrating shapes the founder’s perception of how the whole team is experiencing the implementation regardless of whether that perception reflects the team’s actual relationship with the platform.
And subjective evaluation cannot distinguish between a tool that is not working and a tool that is not being used. Those are different problems with different solutions. A tool that is genuinely poorly fit for the workflow needs to be replaced. A tool that is a good fit but has not been adopted correctly needs a better implementation which is significantly less expensive and disruptive than a full tool switch. Without measurement those two situations produce the same subjective impression and tend to get the same response which is usually to start evaluating alternatives.
Metric one: clarification message volume
What it measures: Whether the tools are functioning as a shared source of truth or whether team members are still resolving information gaps through direct communication.
How to track it: Count the number of messages per week in Slack, email or any other channel where someone asks a question that the SaaS stack should already be answering. “What is the status of the Torres project?” “Who is responsible for the client follow-up?” “Has the proposal gone out yet?” “When is the next deliverable due?”
Each of those messages represents a gap between what the tool contains and what the team trusts. If the project management tool were current and trusted nobody would ask for project status directly they would check the tool. If the CRM were current and trusted nobody would ask who owns a client relationship they would look it up.
What a healthy trend looks like: Declining week over week through the first 90 days of a new tool implementation. A baseline established in week one often surprisingly high that drops meaningfully by week eight or ten as the tools become the default information source rather than an auxiliary one.
What a concerning trend looks like: Flat or rising clarification message volume after 60 days suggests the tools are not being updated consistently enough to be trusted. The team has learned that asking someone directly is more reliable than checking the system which means the system is documenting work rather than managing it.
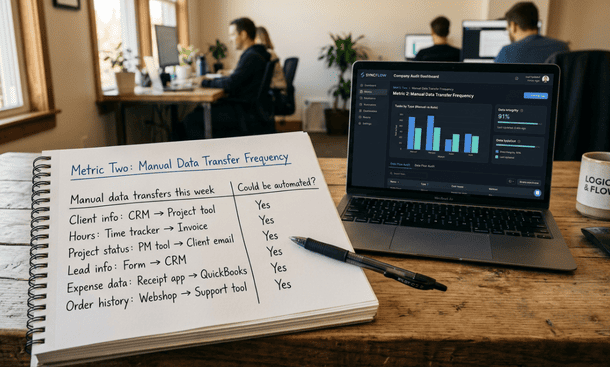
Metric two: manual data transfer frequency
What it measures: How often information is being copied between tools manually rather than flowing through configured integrations.
How to track it: Spend 20 minutes observing or asking your team to document every instance in a single week where they manually copied, re-entered or reformatted information that already existed in one tool in order to get it into another. Client contact details entered into the CRM and then re-entered into the project management tool when a project starts. Hours logged in a time tracking tool and then manually summarized in an invoice. Project status updated in the project management tool and then summarized in an email to the client.
What a healthy number looks like: Fewer than three manual data transfers per week across the full stack. Each one represents either a missing integration or a configured integration that was never activated both of which are fixable with less than an hour of setup investment.
What a concerning number looks like: More than five to seven manual data transfers per week is a signal that the stack’s integration layer is significantly underperforming. That volume of manual transfer represents real weekly overhead typically two to four hours of collective team time that could be eliminated through proper integration configuration.
Metric three: task creation rate
What it measures: Whether the project management tool is functioning as the actual operational record of work being done or as a selective record of some work that someone remembered to log.
How to track it: At the end of each week estimate not precisely, just roughly how many discrete units of work were completed across the business that week. Then count how many tasks were created and completed in the project management tool during the same period. The ratio between those two numbers tells you what percentage of actual work is being managed through the official system.
What a healthy ratio looks like: 70 percent or above. Not every piece of work needs to be a formal task a two minute response to a client email does not warrant a task card. But the significant work deliverables, client interactions with follow up requirements, internal projects with multiple steps should be in the system at a rate that makes the tool a reliable operational record rather than a selective one.
What a concerning ratio looks like: Below 50 percent means more than half of the actual work being done is invisible to the system. At that level the project management tool is primarily being used by the team members who were already task-oriented before the tool was adopted and it is not changing the operational behavior of the team members who needed it most.
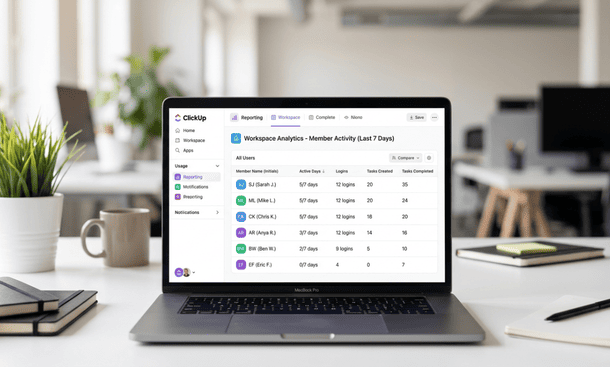
Metric four: daily active users per tool
What it measures: Whether the tools are being used consistently by everyone who was supposed to adopt them or by a subset of the team while others have quietly reverted to informal alternatives.
How to track it: Most SaaS platforms provide basic usage data in their admin settings. Check weekly how many unique team members logged into each tool at least once per day during the previous week. Express it as a percentage of the team members who were expected to use the tool.
What a healthy number looks like: 80 percent or above of expected users logging in daily within 60 days of a tool implementation. Lower rates in the first two to three weeks of adoption are normal the habit is still forming. Rates below 80 percent after 60 days indicate that a meaningful portion of the team has either opted out of the tool or is using it minimally enough to not represent genuine adoption.
What a concerning number looks like: A daily active user rate of 40 to 50 percent after 60 days means roughly half the team has found a way to operate without the tool. That is not a team problem it is an implementation problem. The friction that half the team is experiencing is observable and fixable if surfaced through a direct friction audit rather than allowed to persist until the tool gets replaced.
Metric five: client response time
What it measures: Whether the operational improvements from the SaaS stack are translating into external outcomes that clients experience directly specifically how quickly the business can respond to client requests with accurate, current information.
How to track it: Note the time between a client sending a status request, a question about deliverables or a question about billing and the business providing an accurate, confident response. Track this informally but consistently a rough average across client interactions per month is sufficient.
What a healthy trend looks like: Declining client response time as the stack matures. A well-functioning project management and CRM layer means client questions can be answered in minutes rather than hours because the person handling the inquiry can look up the current status rather than reconstructing it from memory or asking the team to piece it together.
What a concerning trend looks like: Client response times that have not improved or that require the same internal research process they required before the stack was in place suggest the tools are not being maintained currently enough to serve as real time operational references. The stack may be technically in use but it is not changing the information accessibility that makes client service faster and more reliable.
How to use the five metrics together
No single metric tells the complete story. A high daily active user rate combined with a low task creation rate suggests the team is logging into the tool without doing substantive work in it potentially adoption theater rather than genuine adoption. A low clarification message volume combined with high manual data transfer frequency suggests the team trusts the information in the tools but is absorbing significant overhead to keep it current a fixable integration problem rather than an adoption failure.
Reading the metrics together produces a diagnostic picture that is significantly more actionable than any single number. The combinations that indicate genuine operational leverage are declining clarification messages, low manual transfer frequency, high task creation rate, strong daily active users and improving client response time all moving in the right direction simultaneously rather than individually.
When the picture is mixed some metrics healthy and others concerning the concerning ones identify the specific layer or behavior that needs attention rather than suggesting the entire stack needs to be replaced. That specificity is what makes measurement valuable: it replaces the general impression that something is not working with the specific knowledge of what is not working and where the fix needs to happen.
The honest question these metrics answer
Every one of these metrics is a proxy for the same underlying question: is the business running through its systems or around them?
Running through the systems means the tools are the primary operational environment where decisions get made, where information gets created and where the team goes first when they need to know something. Running around the systems means the tools are a secondary record where information gets entered after being managed elsewhere and where the team goes last rather than first because the informal alternatives have proven more reliable under real operational pressure.
A business running through its systems gets the operational leverage that going digital promises compounding efficiency gains, reduced coordination overhead and the ability to grow without proportionally growing the time required to manage operations. A business running around its systems pays for that leverage without receiving it.
These five metrics tell you which situation you are in. They also tell you specifically which part of the stack to address if the situation is the second one which is more useful than a general sense that the tools are underperforming and significantly less expensive than replacing them based on that feeling alone.
Before measuring anything it is worth grounding the evaluation in what a coherent approach to going digital actually requires for a small business to work long-term because measurement only produces actionable insight when the standard being measured against is clear.
Measurement does not need to be elaborate to be useful. Five metrics tracked through normal management activity tell the truth about whether a SaaS stack is delivering operational leverage or consuming budget while the business continues to run on manual processes.
The clarification message volume tells you whether the tools are trusted. The manual data transfer frequency tells you whether the integration layer is working. The task creation rate tells you whether the operational record is complete. The daily active user rate tells you whether the adoption is genuine or selective. And the client response time tells you whether the internal improvements are translating into external outcomes.
Track them for 90 days. Read them together rather than individually. Use them to identify what is working and what needs targeted adjustment and to make the distinction between a tool that is not working and a tool that is not being used, which are very different problems that require very different responses.
The full cycle from understanding what going digital means through building the foundation, choosing the stack, implementing it correctly, avoiding the mistakes that keep businesses manual and measuring whether it is actually working starts with a clear picture of why so many businesses get this process wrong despite genuinely trying to get it right. That starting point is exactly what why most small businesses fail at going digital and what the real causes look like in practice lays out in full.
About the Author

Pamela
Pamela is a dynamic professional with a deep passion for SaaS and emerging technologies. She provides valuable insights into software trends, digital innovation, and cutting-edge tools that empower businesses to thrive and expand.
Did you find this helpful?
Your feedback helps us curate better content for the community.