Choosing the right ERP analytics tool can feel like trying to pick the perfect taco spot in LA—there are way too many options and everyone’s got an opinion. But here’s the thing: the tool you choose literally determines whether you’ll be swimming in actionable insights or drowning in spreadsheets. I’ve spent months testing platforms and talking to founders who’ve successfully implemented analytics strategies for their growing ventures, and I’m stoked to share what’s actually working right now. Whether you’re running a bootstrapped startup in Oakland or scaling fast in Orange County, one of these seven tools is gonna be your perfect match.
What to look for before comparing tools
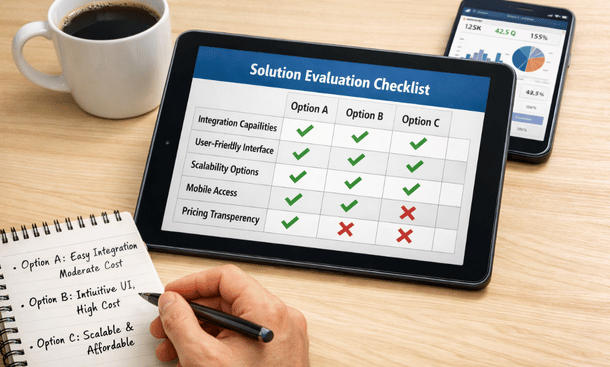
Before we jump into specific platforms, let’s talk about what actually matters when you’re evaluating ERP analytics software. This isn’t about finding the tool with the most features or the fanciest interface. It’s about finding the one that solves your specific problems without creating new ones.
First consideration is integration capability. Your analytics tool needs to play nice with your existing systems. If you’re running QuickBooks for accounting and Salesforce for CRM, your analytics platform better have solid connectors for both. The last thing you need is spending weeks building custom integrations or manually importing data.
Second is ease of use. I cannot stress this enough. A powerful tool that nobody on your team actually uses is worthless. Look for intuitive interfaces where you can build dashboards and run reports without needing a PhD in data science.
Third is scalability. Sure, you might be a five-person team right now, but hopefully you’re planning to grow. Make sure the platform can handle increased data volume and more users without requiring a complete migration in 18 months.
Fourth is mobile accessibility. You’re not always sitting at your desk, and sometimes you need to check those numbers while you’re grabbing coffee or sitting in traffic on the 405. A solid mobile app or responsive web interface is non-negotiable for modern entrepreneurs.
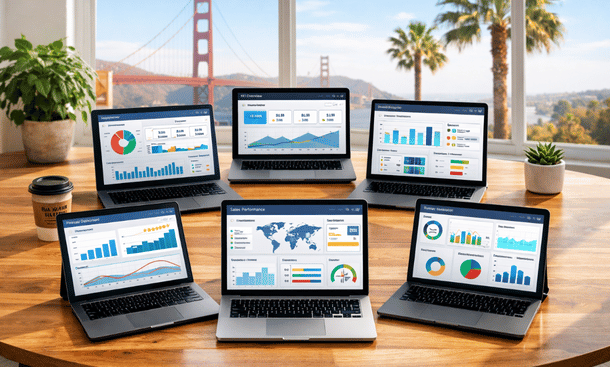
Tech Evaluation Setup
Power BI: The versatile workhorse
Microsoft Power BI has become huge in the California startup scene, and for good reason. It connects to basically everything, from your SQL databases to your SaaS applications, and the learning curve is surprisingly gentle for a tool this powerful.
What I love about Power BI is the balance it strikes. It’s sophisticated enough to handle complex data modeling and advanced analytics, but the drag-and-drop interface means your operations manager can build useful dashboards without bugging your tech team constantly.
The pricing is pretty friendly too. You can start with the free version to test it out, then move to Pro at $10 per user per month, or Premium if you need more horsepower. For most small to medium businesses, Pro does everything you need.
The downside? It’s Microsoft, so it works best if you’re already in that ecosystem. If you’re running on Mac or prefer Google Workspace, you might hit some friction points. Also, the sheer number of features can feel overwhelming initially.
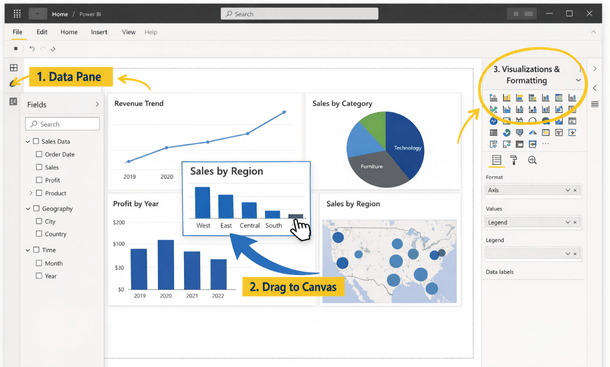
Tableau: When visualization is everything
Tableau is the tool you choose when presenting data is as important as analyzing it. I’ve seen pitch decks and board presentations built with Tableau that literally made investors lean forward in their chairs.
The visualization capabilities are absolutely next level. We’re talking interactive dashboards that let you drill down into data with a single click, geographic mapping that shows regional performance instantly, and customization options that let you match your brand perfectly.
Tableau connects well with most ERP systems, especially if you’re running on Oracle, SAP, or NetSuite. The community is massive too, which means you can find tutorials and templates for almost anything you’re trying to build.
Where Tableau stumbles is pricing and complexity. It’s definitely on the higher end of the cost spectrum, starting around $70 per user per month for Tableau Creator. And while it’s powerful, it takes time to master. Plan on investing in training or hiring someone who already knows the platform.
Zoho Analytics: The budget-friendly option
Let’s be real. Not every startup has thousands of dollars per month to drop on analytics software. That’s where Zoho Analytics shines.
For $24 per month, you get a surprisingly robust platform that handles most of what growing businesses need. It integrates smoothly with Zoho’s suite of business apps, but also connects to external sources like Google Analytics, Mailchimp, and most major databases.
I’ve recommended Zoho to several pre-seed and seed-stage founders who needed something functional without breaking the bank. The AI-powered assistant is actually pretty helpful for building queries in plain English, which removes a lot of the technical barriers.
The tradeoff is that you won’t get the advanced features that enterprise platforms offer. The visualizations are good but not stunning. Performance can lag with really large datasets. But for startups under $2 million in revenue, it’s honestly perfect.
Sisense: For complex data environments
If your data lives in multiple places and you need serious analytics horsepower, Sisense deserves a close look. This platform was built specifically for handling complex data from disparate sources.
What sets Sisense apart is the In-Chip technology that processes data incredibly fast. I’m talking dashboards that load in seconds even when you’re working with millions of rows. For e-commerce companies or SaaS businesses with high transaction volumes, this speed difference is game-changing.
The embedded analytics feature is clutch if you want to white-label dashboards for clients or include analytics in your own product. Several California SaaS companies use Sisense as the backbone of their customer-facing reporting.
Pricing is custom and generally starts in the enterprise range, which puts it out of reach for early-stage startups. But if you’ve raised a Series A or beyond and data is core to your business model, the investment makes sense.

Domo: The all-in-one collaboration platform
Domo takes a different approach by combining analytics with collaboration tools and workflow automation. It’s less of a pure analytics platform and more of a business intelligence ecosystem.
The mobile experience on Domo is legitimately the best I’ve used. You can set up alerts that ping you when metrics hit certain thresholds, review dashboards on your phone while waiting for your coffee, and even approve workflows without opening a laptop.
Where Domo really shines is connecting people across your organization around data. The social collaboration features let team members comment on dashboards, share insights, and work together on solving problems revealed by the analytics.
The main barrier is cost. Domo is expensive, typically starting around $750 per month for small teams. You’re not just paying for analytics though. You’re paying for a platform that can replace several other tools in your stack.
Qlik Sense: The self-service champion
Qlik Sense built its reputation on associative analytics, which sounds technical but basically means you can explore data relationships intuitively without predefined queries. Click on any data point and immediately see how it relates to everything else.
This self-service approach empowers your entire team to answer their own questions instead of submitting requests to a data team. Your sales manager can investigate why deals are stalling in a specific region. Your marketing director can trace which campaigns correlate with high-value customers.
The cloud version is straightforward to implement, and Qlik offers solid training resources. The pricing is consumption-based, which means you pay for what you actually use rather than committing to per-user licenses upfront.
The learning curve exists but it’s manageable. Some users find the interface less intuitive than Power BI or Tableau initially. And like most platforms, you’ll get more value if you invest time in really learning the tool rather than just scratching the surface.
Looker: Built for modern data stacks
Looker, which Google acquired in 2019, is designed specifically for companies running modern cloud data warehouses like BigQuery, Snowflake, or Redshift. If that’s your infrastructure, Looker is worth serious consideration.
The LookML modeling layer is Looker’s secret weapon. It creates a semantic layer between your raw data and your business users, which means everyone works from consistent definitions. No more arguments about how revenue or customer lifetime value is calculated.
The downside is that Looker requires more technical setup than most other tools on this list. You’ll probably need a data engineer or someone comfortable with SQL to get it configured properly. Once it’s set up though, business users can build their own reports easily.
Pricing is enterprise-focused and custom, so expect to have a conversation with their sales team. For venture-backed startups with technical teams, it’s often the right choice. For non-technical founders bootstrapping, it might be overkill.
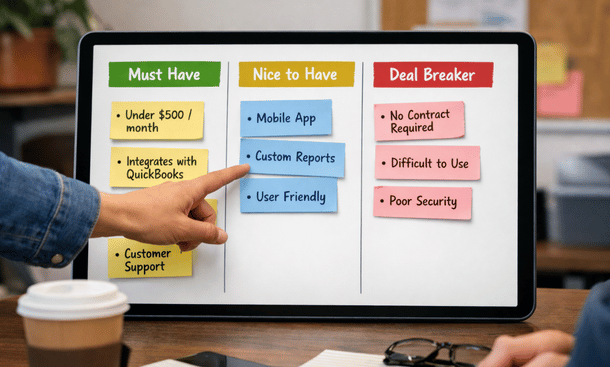
Making your decision without analysis paralysis
Here’s my honest advice after watching dozens of California entrepreneurs navigate this decision. Don’t spend three months evaluating every option. Pick two or three that seem promising based on your budget and technical requirements, sign up for free trials, and actually use them for a week each.
Build the same dashboard in each platform using your real data. See which one feels natural, which one your team actually wants to use, and which one gives you the insights you need without making you work too hard for them.
Most founders overthink this decision. The truth is that any of these seven tools will work fine if you commit to implementing it properly. The bigger risk is spending so much time choosing that you never actually get started.
Price-to-value sweet spots for different stages
Let me break down which tools make sense at different stages of your business, because your budget and needs change dramatically as you grow.
If you’re pre-revenue or under $500K annually, start with Zoho Analytics or the free version of Power BI. You need visibility into your numbers, but you can’t justify $1,000 per month on analytics yet. These options give you 80 percent of what you need at a fraction of the cost.
Between $500K and $2 million in revenue, Power BI Pro or Qlik Sense Cloud become great options. You’ve got enough complexity that better tools save you significant time, and the pricing is still reasonable relative to your revenue.
Once you’re past $2 million and especially if you’ve raised significant funding, you can consider the premium options like Tableau, Sisense, Domo, or Looker. At this stage, better analytics directly impacts your ability to scale efficiently, so the investment pays for itself quickly.
Integration considerations for California businesses
One thing I’ve noticed working with California startups is that our tech stacks tend to be pretty diverse. You might be running Shopify for e-commerce, Stripe for payments, Google Workspace for productivity, QuickBooks for accounting, and HubSpot for marketing.
Before committing to any analytics platform, literally make a list of every system that contains important business data. Then verify that your chosen tool has native integrations or at least API access to those systems.
Some platforms advertise hundreds of integrations but their pre-built connectors are limited. You might need to use a middleware tool like Zapier or build custom connections, which adds cost and complexity. Ask specifically about the integrations you need during your evaluation.
The implementation reality check
Buying the tool is honestly the easy part. Actually implementing it so your team uses it daily is where most companies stumble.
Plan on spending at least a month getting things set up properly, even with the more user-friendly platforms. You need to connect your data sources, build your initial dashboards, train your team, and establish processes around how insights get shared and acted upon.
The companies that succeed with ERP analytics treat implementation as a project with dedicated time and resources, not something they’ll figure out whenever someone has a spare hour. Block out focused time, assign clear ownership, and set realistic milestones.
Also, start simple. Build three dashboards that answer your most pressing questions rather than trying to visualize everything. You can always expand later once the habit of using analytics is established.
Moving from selection to action
Now that you’ve got a solid understanding of the leading ERP analytics tools available to California entrepreneurs, the next logical step is actually getting your chosen platform configured and running. The gap between signing up for a tool and seeing value from it is where most implementations fail.
Want to avoid those common pitfalls and ensure your new analytics platform actually delivers ROI? Head over to our guide on how to set up ERP analytics dashboards that drive revenue where we walk through the exact implementation process. And if you want to see how all these tools fit into the broader analytics strategy, check out our comprehensive ERP analytics guide for California entrepreneurs.
About the Author

mike
Mike is a tech enthusiast passionate about SaaS innovation and digital growth. He explores emerging technologies and helps businesses scale through smart software solutions.
Did you find this helpful?
Your feedback helps us curate better content for the community.