
Real talk—I’ve watched way too many California entrepreneurs drop serious cash on ERP analytics platforms only to completely whiff on the implementation. We’re talking $50K, $100K, sometimes more, basically flushed down the toilet because of totally avoidable mistakes. The worst part? These aren’t even complicated technical errors; they’re strategic missteps that happen before you even log into the dashboard. Whether you’re just starting to explore how successful entrepreneurs are leveraging analytics platforms or you’re mid-implementation and something feels off, understanding these common pitfalls will save you a ridiculous amount of money, time, and stress. Let’s dive into what actually goes wrong and how to dodge these expensive mistakes.
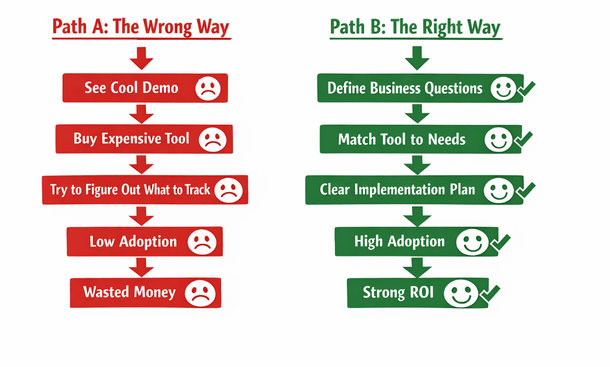
Mistake one: buying software before defining your questions
This is hands down the most expensive mistake I see founders make. They get excited about ERP analytics, read some case studies, talk to a slick sales rep, and drop five figures on a platform without ever clearly defining what business questions they need to answer.
Here’s what happens next. They’ve got this powerful tool, but nobody knows what to do with it. The team builds a few random dashboards that look cool but don’t drive any decisions. Six months later, the platform is barely used and renewal time becomes an awkward conversation about whether to keep paying for something that isn’t delivering value.
The right approach flips this completely. Before you talk to a single vendor, sit down and list out the ten most important questions you need answers to. What products are actually profitable after all costs? Which customer segments have the highest lifetime value? Where are we losing deals in the sales process? What’s our real cash runway?
These questions become your requirements. When you’re evaluating platforms, you’re asking “can this tool answer these specific questions?” rather than “what cool features does this have?” This clarity transforms the buying process from overwhelming to straightforward.
I know a founder in Berkeley who almost bought a $30K annual subscription to a fancy analytics platform. Then she did this exercise and realized her critical questions could all be answered with a $300 per month tool. She saved $27K in year one by getting clear on requirements first.
Path to Success
Mistake two: implementing without clean data foundations
You’ve heard the phrase garbage in, garbage out? That’s not just a catchy saying. It’s the reality of analytics implementations that fail because nobody bothered to clean up their data before connecting it to dashboards.
When your source systems have duplicate customer records, inconsistent product categorizations, incomplete transaction histories, or any of the countless data quality issues that plague most businesses, those problems get amplified in your analytics platform. You end up with dashboards that show contradictory information, reports that don’t match your accounting system, and metrics that nobody trusts.
The insidious part is that you often don’t discover these issues until after you’ve paid for the platform and invested weeks in setup. Then you’re faced with either doing the painful data cleanup work that should have happened first, or living with unreliable analytics that nobody will use.
Before connecting any analytics platform to your source systems, do a data audit. Pull reports from each system and look for obvious issues. Are customer names consistent? Do product SKUs match across systems? Are transactions recording all required fields? Do your numbers reconcile when you compare different sources?
This audit usually reveals problems that need fixing. Yes, it’s tedious work. Yes, it delays your analytics implementation by a few weeks. But those weeks save you months of frustration and ensure that when your dashboards go live, people can actually trust what they’re seeing.
A San Francisco retail company spent $40K on an analytics implementation that failed because their inventory system had years of inconsistent data. Products were categorized differently over time, SKUs had been reused, and location codes didn’t match across their stores. They had to spend another $25K on data cleanup before they could get useful insights. That entire nightmare could have been avoided with a thorough audit upfront.
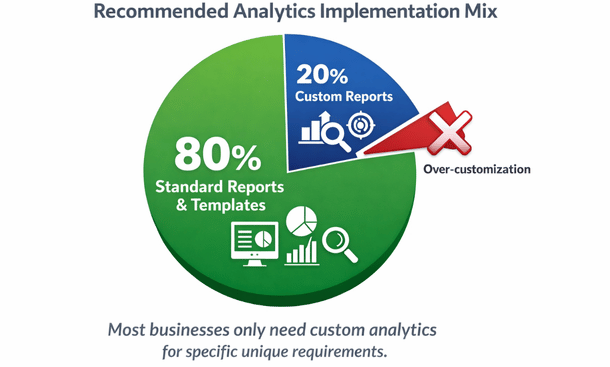
Mistake three: over-customizing instead of using standard reports
There’s something seductive about customization. Analytics platforms offer incredible flexibility, and it’s tempting to build elaborate custom reports that capture every nuance of your unique business. But customization is expensive, time-consuming, and often unnecessary.
Every custom dashboard or report you build is something you have to maintain. When your business processes change, when you upgrade software, when you add new products or services, those custom reports break and need updating. You’re creating technical debt that compounds over time.
The smarter approach is to start with standard reports and templates that come with your platform. These are built on best practices from thousands of implementations. They work out of the box, they’re maintained by the vendor, and they often surface insights you wouldn’t have thought to look for on your own.
Use standard reports for 80 percent of your needs, then customize only the 20 percent where your business truly requires something unique. This keeps your implementation lean, maintainable, and cost-effective.
I’ve seen companies spend $50K on custom dashboard development when the standard templates would have served them perfectly. Worse, those custom dashboards became increasingly difficult to maintain as the business evolved, eventually requiring a complete rebuild.
Mistake four: skipping training and change management
You can build the most beautiful, powerful analytics system in the world, but if your team doesn’t know how to use it or doesn’t want to use it, you’ve built an expensive paperweight.
The technical implementation is honestly the easy part. The hard part is changing how people work. Your sales team needs to start checking dashboards instead of asking for reports. Your operations manager needs to trust the system’s inventory numbers. Your CFO needs to use the platform for financial reviews instead of exporting to Excel.
This behavioral change doesn’t happen automatically. It requires training, ongoing support, and often some tough conversations about new expectations. Companies that skip this change management work end up with analytics platforms that get used by one or two people while everyone else continues with their old processes.
Effective training isn’t a one-time event. It’s an ongoing process. Start with structured training sessions where people learn the basics. Follow up with regular office hours where team members can ask questions. Create simple reference guides for common tasks. Celebrate wins when people discover useful insights using the platform.
You also need executive buy-in and modeling. If the leadership team isn’t using the analytics system in their decision-making, why would anyone else? Make it clear through actions, not just words, that data-driven decisions using the new platform are how the company operates now.
A San Diego company spent $35K implementing an analytics platform that sat unused for eight months because nobody trained the team. By the time they brought in a trainer and did proper change management, half the team had already decided the system wasn’t useful and were resistant to adopting it.
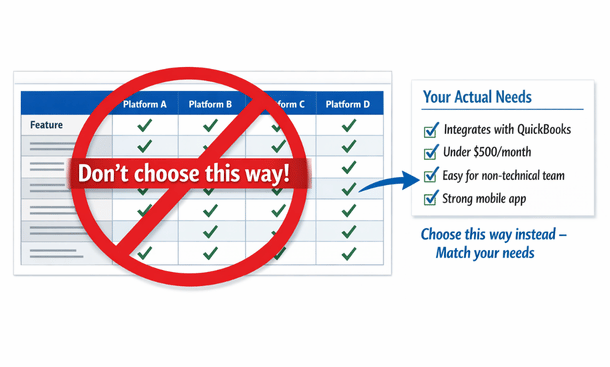
Mistake five: choosing platforms based on features instead of fit
Every analytics platform has an impressive list of features. Advanced AI, machine learning capabilities, hundreds of pre-built connectors, mobile apps, collaboration tools, the list goes on. The mistake is choosing based on who has the longest feature list rather than who fits your specific situation.
A platform with 500 integrations is useless if it doesn’t integrate with the five systems you actually use. Advanced machine learning is cool but irrelevant if you don’t have the data volume or use cases to leverage it. Enterprise-grade security is necessary for some companies and overkill for others.
What matters is the match between what the platform does well and what you need most. Are you a visual thinker who needs stunning dashboards? Pick a tool known for visualization. Do you have complex data from many sources? Prioritize integration capabilities. Is your team non-technical? Choose something with a gentle learning curve.
Also consider the platform’s ideal customer profile. Some tools are built for enterprises and work poorly for small businesses. Others are designed for startups and lack features that growing companies need. Using a tool outside its sweet spot creates friction and frustration.
Talk to other businesses similar to yours in size, industry, and technical sophistication. What are they using? What do they wish they’d known before choosing? This real-world feedback is worth more than any feature comparison chart.
Choose Needs, Not Matrix
Mistake six: ignoring mobile accessibility
Here’s a mistake that doesn’t seem like a big deal until it kills your adoption rates. You implement an analytics platform that works beautifully on desktop computers but is clunky or unusable on phones and tablets.
The problem is that modern entrepreneurs and managers live on their mobile devices. You’re checking business metrics while grabbing morning coffee, during your commute, between meetings, waiting for appointments. If your analytics platform requires you to be at a desk with a large monitor, you’re dramatically limiting when and how people engage with the data.
I check my most important dashboards on my phone probably ten times more often than I check them on my laptop. That behavior is typical, not exceptional. Mobile access turns analytics from something you make time for into something you naturally weave into your day.
When evaluating platforms, test the mobile experience thoroughly. Can you view all critical dashboards on a phone? Are they readable without zooming and scrolling? Can you interact with filters and drill-downs? Do alerts work on mobile? Can you share insights easily?
Some platforms have great desktop experiences but barely functional mobile apps. Others are truly mobile-first with thoughtfully designed responsive interfaces. This difference matters enormously for actual usage.
A Los Angeles founder told me they almost never used their expensive analytics platform because it required logging into a desktop application. Once they switched to a cloud platform with a solid mobile app, their engagement with the data increased tenfold and they started catching issues and opportunities they’d been missing.
Mistake seven: building dashboards for everyone instead of roles
When you’re excited about analytics, it’s tempting to create a comprehensive master dashboard that shows everything to everyone. Revenue, expenses, inventory, customer metrics, operational KPIs, all on one screen. The problem is that this creates information overload and reduces usefulness for everyone.
Your sales manager doesn’t need to see detailed inventory metrics. Your warehouse manager doesn’t need customer acquisition cost breakdowns. Your marketing director doesn’t need accounts payable aging. When people have to wade through irrelevant information to find what matters to them, they stop looking.
The smarter approach is building role-specific dashboards that show each person or team exactly what they need to do their job well. Sales dashboards focus on pipeline, conversions, and quota attainment. Operations dashboards track fulfillment, quality, and efficiency. Finance dashboards monitor cash, expenses, and profitability.
This doesn’t mean completely siloing information. Key metrics can appear on multiple dashboards. But the organization, emphasis, and detail level should match the needs of the primary audience.
Role-based dashboards also solve a security and privacy concern. Not everyone in your organization needs access to all financial data or sensitive customer information. Proper role-based access control protects confidential information while still democratizing the data that should be shared.
Setting this up properly requires thinking through your organizational structure and information flows. It takes more work upfront than creating one generic dashboard, but it pays off in higher adoption and better decision-making across the company.
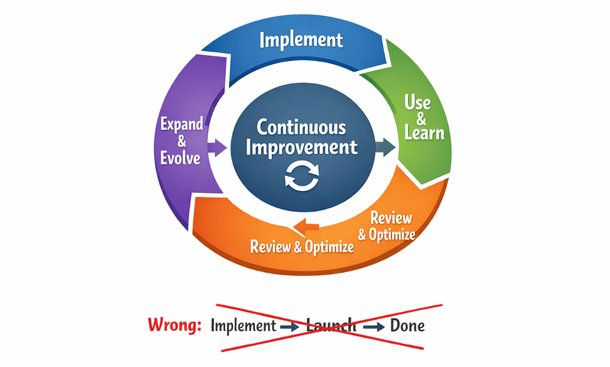
Mistake eight: treating analytics as a one-time project
Analytics implementations fail when companies treat them like installing software rather than building a capability. They go through an intense setup phase, get everything configured, celebrate the launch, and then move on to other priorities. Six months later, the analytics system is outdated, dashboards show irrelevant metrics, and nobody’s maintaining it.
Analytics is not a project with an end date. It’s an ongoing practice that needs continuous attention. Your business changes, your priorities evolve, new data sources become available, and dashboards need updating to stay relevant.
Successful companies assign clear ownership for analytics maintenance. Someone needs to be responsible for keeping dashboards current, adding new metrics as needed, troubleshooting issues, and ensuring the system continues delivering value. This doesn’t have to be a full-time job, but it needs to be someone’s explicit responsibility.
Schedule quarterly reviews of your analytics setup. What’s working well? What’s not being used? What new questions do we need to answer? What data sources should we add? These regular check-ins keep your analytics aligned with your business needs.
Also budget for ongoing investment. New integrations, additional users, platform upgrades, training for new team members—these costs continue beyond the initial implementation. Companies that don’t plan for this find themselves unable to scale their analytics as the business grows.
Mistake nine: neglecting data security and compliance
This mistake can be the most expensive of all because the costs show up as legal problems, compliance violations, or security breaches rather than wasted software spending.
When you connect an analytics platform to your business systems, you’re creating new pathways for sensitive data to flow. Customer information, financial records, employee data, and proprietary business metrics all become accessible through the analytics system. If you don’t secure these pathways properly, you’re creating vulnerabilities.
Basic security measures that companies often skip include enforcing strong authentication, requiring VPN access for remote users, encrypting data at rest and in transit, and regularly reviewing who has access to what data. These aren’t optional nice-to-haves. They’re necessary protections.
Compliance requirements add another layer. If you handle payment card data, HIPAA-regulated health information, or EU customer data covered by GDPR, your analytics system needs to comply with those regulations. Violations aren’t just expensive fines—they damage your reputation and customer trust.
Before implementing analytics, talk to whoever handles security and compliance at your company. If that’s you, do research on what regulations apply to your industry and customer base. Make sure your chosen platform has appropriate security certifications and compliance capabilities.
Also establish clear data governance policies. Who can access what data? How long is data retained? What can be exported or shared externally? These policies prevent accidental violations and intentional misuse.
I know a healthcare startup that chose an analytics platform without verifying HIPAA compliance. They invested $45K in implementation before discovering during an audit that the platform didn’t meet requirements. They had to scrap everything and start over with a compliant solution.
Mistake ten: measuring vanity metrics instead of actionable KPIs
The final expensive mistake is filling your dashboards with metrics that feel important but don’t actually drive decisions or actions. These vanity metrics make you feel like you’re being data-driven without delivering real business value.
Total registered users sounds impressive but doesn’t tell you much about business health. What matters is active users, engaged users, paying users. Total revenue is important but gross profit and net profit matter more. Website traffic is nice but conversion rate is what impacts your bottom line.
Vanity metrics are often easily inflated, which makes them seductive but misleading. You can boost website traffic with low-quality ads that never convert. You can increase registered users with loose signup requirements that bring in people who never engage. You can grow revenue while losing money on every sale.
Actionable KPIs have three characteristics. First, they connect directly to business outcomes you care about. Second, they’re specific and measurable with clear definitions. Third, changes in the metric suggest specific actions you should take.
Before adding any metric to your dashboard, ask yourself what decision this metric informs or what action a change in this metric would trigger. If you can’t answer clearly, it’s probably a vanity metric that’s cluttering your dashboard without adding value.
A good test is imagining the metric moving in an undesirable direction. If revenue per user drops 20 percent, you know exactly what that means and can think of multiple potential responses. If total page views drop 20 percent, the implications and appropriate responses are much less clear.
The hidden costs of poor analytics implementations
Beyond the direct costs of wasted software subscriptions and failed implementations, poor analytics decisions create hidden costs that are harder to quantify but equally damaging.
Opportunity cost is huge. While you’re struggling with a bad analytics setup, you’re missing insights that could grow your business. Competitors with better analytics are making faster, smarter decisions and pulling ahead.
Team morale and trust suffer when analytics implementations fail. People invest time learning systems that don’t work, they lose confidence in data-driven decision making, and they become resistant to future improvement initiatives.
Bad data leading to bad decisions can be catastrophically expensive. If your analytics tell you a product line is profitable when it’s actually losing money, you might invest heavily in scaling something that’s dragging down your entire business.
The time cost of manual workarounds adds up quickly. When your analytics system doesn’t work, people build spreadsheets, export data manually, and create informal processes to get the information they need. This inefficiency compounds daily.
All of these hidden costs are avoidable by making smart decisions upfront and implementing analytics thoughtfully rather than hastily.
Creating a checklist to avoid these mistakes
Let me give you a practical framework for ensuring you don’t fall into any of these traps. Before you buy any analytics platform and during your implementation, use this checklist to stay on track.
Before buying: List your top ten business questions that analytics should answer. Verify that candidate platforms integrate with your existing systems. Test mobile experiences thoroughly. Check security and compliance requirements. Talk to businesses similar to yours about their experiences. Calculate total cost of ownership including training and maintenance.
During implementation: Clean and validate source data before connecting. Start with standard reports and templates. Create role-specific dashboards for different team members. Plan formal training sessions and ongoing support. Assign clear ownership for maintenance. Define actionable KPIs, not vanity metrics. Set up appropriate security and access controls.
After launch: Schedule quarterly reviews to assess what’s working. Budget for continuous improvement and expansion. Monitor adoption rates and address resistance. Keep dashboards updated as business priorities change. Measure ROI based on better decisions and time saved.
This checklist won’t guarantee success, but it will dramatically reduce your risk of expensive mistakes that derail implementations.
Closing the loop on your analytics strategy
You now understand the critical mistakes that drain budgets and derail ERP analytics implementations. But knowledge of what not to do is only half the equation. Building an analytics strategy that actually works requires understanding the fundamentals from the ground up.
Ready to make sure you’ve got a solid foundation before diving into tools and dashboards? Go back to our foundational guide on what ERP analytics is and why California startups need it to ensure you’ve nailed the basics. And when you’re ready for the complete roadmap that ties together everything from selection to implementation to optimization, check out our comprehensive ERP analytics guide for California entrepreneurs.
About the Author

mike
Mike is a tech enthusiast passionate about SaaS innovation and digital growth. He explores emerging technologies and helps businesses scale through smart software solutions.
Did you find this helpful?
Your feedback helps us curate better content for the community.