
Your finance team is stuck in the weeds. They’re juggling multiple software platforms that don’t talk to each other. They’re manually entering the same data three times across different systems. Month-end close takes forever because someone needs to reconcile everything by hand. Your executives ask for reports that take days to compile instead of minutes.
This isn’t just annoying. It’s costing you real money and limiting your growth. Every hour your accountants spend on manual data entry is an hour they’re not analyzing trends, forecasting cash flow, or helping business leaders make better decisions.
California’s business environment moves fast. Your competitors are making data-driven decisions in real time while you’re waiting for last month’s financials. Your investors expect transparency and instant visibility into your metrics. Your team needs accurate financial information to execute effectively.
ERP systems for finance solve this problem by bringing all your financial processes into one unified platform. Instead of data scattered across QuickBooks, Excel, your banking portal, payroll system, and wherever else, everything lives in a single source of truth. Your team works from the same information. Reports generate automatically. Processes flow smoothly from beginning to end.
The shift from fragmented accounting software to integrated financial ERP changes how your entire organization operates. Finance becomes a strategic function instead of a bottleneck. Decision-makers get the information they need when they need it. Your company scales without your finance team growing proportionally.
Understanding how financial ERP systems work and what they can do for your business is the first step toward building a modern finance operation that supports growth instead of constraining it.
What Is Financial ERP and Why California Businesses Are Going All-In
Financial ERP systems represent a fundamental shift from traditional accounting software. Where tools like QuickBooks handle basic bookkeeping, ERP platforms manage your entire financial ecosystem with integrated processes, automated workflows, and real-time visibility.
The core difference comes down to integration and scale. Basic accounting software tracks transactions and produces financial statements. That works fine when you’re small and simple. But as California businesses grow, they hit limitations fast. You need to manage multiple entities. You’re dealing with different currencies. You have complex revenue recognition requirements. You need sophisticated reporting that slices data by department, project, customer, and product.
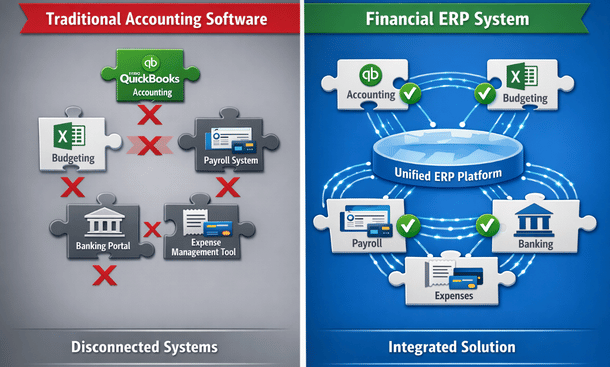
A financial ERP system brings together general ledger, accounts payable, accounts receivable, cash management, financial reporting, budgeting, and compliance into one platform. Everything connects. Data flows automatically between modules. When sales posts an invoice, it updates accounts receivable, impacts cash forecasting, and flows into financial reporting without anyone manually moving information around.
The architecture matters because it determines what’s possible. Traditional accounting software stores data in rigid structures that make custom reporting difficult. Modern ERP platforms use flexible data models where you can analyze financial information across multiple dimensions simultaneously. You can see revenue by customer, by product, by region, and by sales rep all at once.
Cloud deployment has made financial ERP accessible to companies that couldn’t afford it before. You’re not buying servers, hiring IT staff, or managing infrastructure. The system runs in the cloud with automatic updates, enterprise-grade security, and access from anywhere. Your team in San Francisco sees the same real-time data as your office in San Diego.
For California’s fast-growing startups and mid-market companies, this combination of integration, flexibility, and cloud deployment solves problems that held back growth. You can scale operations without proportionally scaling your finance headcount. You can give stakeholders self-service access to financial information. You can automate routine tasks and redeploy your team to higher-value work.
The companies making the switch typically hit one of several triggers. They’re preparing for a funding round and investors want clean, auditable financials. They’re growing so fast that current systems can’t keep up. They’re expanding internationally and need multi-currency and multi-entity capabilities. They’re drowning in manual processes and need automation to survive.
Remote work accelerated adoption significantly. When your finance team isn’t in the same office, working from a unified cloud platform beats emailing spreadsheets back and forth. Everyone sees current data. Workflows route automatically. Approvals happen from phones. The system becomes your virtual office for all financial operations.
Understanding what makes financial ERP systems different from accounting software you might already know sets the foundation for evaluating whether your business needs this capability. The detailed explanation of how these systems work and what they enable appears in our comprehensive breakdown of financial ERP fundamentals and why growing businesses make the transition.
Security and compliance built into ERP platforms also matter more as you scale. Every transaction gets logged with complete audit trails. Access controls ensure people see only what they should. Automated workflows enforce approval policies consistently. When auditors arrive or regulators ask questions, you can produce documentation instantly instead of scrambling through emails and filing cabinets.
The investment required isn’t trivial. Financial ERP implementations typically cost tens of thousands of dollars and take months to complete properly. But for California businesses dealing with complexity and growth, the alternative is worse. Staying on inadequate systems constrains what you can do and creates risk through manual processes prone to error.
Top 7 ERP Systems for Finance Teams (2025 Comparison)
Choosing the right financial ERP platform might be the most consequential technology decision your company makes. Pick wrong and you’re locked into expensive software that frustrates your team and limits what you can do. Pick right and your finance operations transform into a competitive advantage.
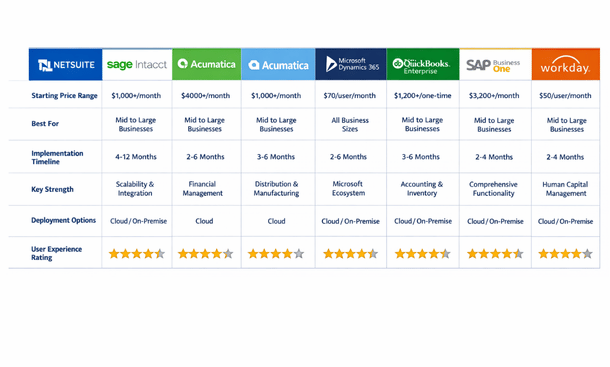
The market offers dozens of options, but seven platforms dominate among California finance teams. Each has distinct strengths, pricing models, and ideal customer profiles. Understanding these differences helps you narrow choices quickly.
NetSuite leads the cloud ERP market, especially among tech companies and high-growth businesses. Oracle acquired NetSuite years ago and poured resources into development, making it a comprehensive platform that handles financials, inventory, e-commerce, and CRM in one system. The financial management capabilities are robust with strong multi-currency support, advanced revenue recognition, and sophisticated consolidation features for companies with multiple entities.
What makes NetSuite appealing is configurability without heavy customization. You can adapt workflows to match your processes through point-and-click configuration rather than writing code. The reporting engine lets finance teams create custom reports and dashboards without developer involvement. For California startups scaling fast and dealing with complexity, this flexibility matters enormously.
The downside is cost. NetSuite implementations typically start around fifty thousand dollars annually for smaller companies and scale up significantly with additional users and modules. Implementation takes several months even for straightforward deployments. You also need to factor in ongoing costs for optimization and support.
Sage Intacct built its reputation specifically on financial management excellence. Accountants designed it for accountants, and that focus shows throughout the platform. The dimensional reporting stands out as particularly powerful, letting you analyze financial data by department, location, project, customer, or any custom dimension you define. For companies needing detailed visibility into profitability by segment, this capability alone justifies consideration.
The automation features in Sage Intacct are excellent. Multi-entity consolidations happen automatically with intercompany eliminations. The accounts payable module can handle invoice processing from capture through payment with minimal human involvement. Recurring journal entries like depreciation and amortization post automatically based on rules you establish once.
Sage Intacct also offers strong vertical solutions. If you’re in nonprofits, healthcare, hospitality, or professional services, they’ve built industry-specific functionality that addresses common pain points in those sectors. The system understands the unique accounting requirements and reporting needs without requiring extensive customization.
Pricing typically starts around twenty-five hundred dollars monthly for smaller implementations, making it more accessible than NetSuite for mid-market companies. The interface feels somewhat dated compared to newer platforms, but functionality matters more than aesthetics for most finance teams.
Acumatica takes a different approach to pricing that appeals to growing companies. Instead of per-user licensing, they charge based on resource consumption. This means you can give access to your entire organization without worrying about per-seat costs escalating. For companies with distributed teams where many people need occasional access to financial information, this model makes economic sense.
The platform is genuinely flexible with modern architecture that supports customization without complex coding. For California businesses with unique processes that don’t fit standard workflows, Acumatica’s adaptability becomes a major advantage. The financial management suite covers everything you’d expect including general ledger, accounts payable and receivable, cash management, and comprehensive reporting.
The project accounting module deserves special mention if you run a services business or do project-based work. You can track costs, revenue, and profitability at the project level with real-time visibility into budget status and forecast to complete. This granular visibility helps services firms stay profitable on complex engagements.
Mobile access in Acumatica is more than an afterthought. The mobile app provides real functionality for approving transactions, viewing dashboards, and performing meaningful work from your phone. For executives and managers who aren’t desk-bound, this mobility matters.
The main challenge with Acumatica is finding qualified implementation partners. The ecosystem is smaller than NetSuite or Microsoft, which can make support and specialized expertise harder to locate in some regions. Pricing typically starts around fifteen hundred dollars monthly and scales based on usage metrics rather than user count.
Microsoft Dynamics 365 Finance deserves serious consideration if your company already operates in the Microsoft ecosystem. The integration with Office 365, Teams, Power BI, and other Microsoft tools is seamless because it’s all from the same vendor. For organizations standardized on Microsoft technology, this native integration eliminates countless integration headaches.
The platform is powerful and enterprise-grade, capable of handling incredibly complex financial scenarios, multiple currencies, and sophisticated compliance requirements. Large corporations use Dynamics 365, which demonstrates its capabilities at scale. The reporting and analytics leveraging Power BI are exceptional, letting you create interactive dashboards that non-finance stakeholders actually want to use.
However, Dynamics 365 comes with enterprise complexity. Implementation typically requires experienced consultants and can extend six months or longer. The learning curve is steeper than more intuitive platforms. The pricing model also gets complicated quickly with different license types, modules, and add-ons that make forecasting true costs challenging.
QuickBooks Enterprise deserves mention despite not being a true cloud ERP in the same category as other options here. For companies outgrowing QuickBooks Online but not ready for full enterprise systems, QuickBooks Enterprise provides a middle ground. The biggest advantage is familiarity since most finance teams already know QuickBooks fundamentals.
The platform handles up to forty users and significantly larger data volumes than small business versions. Industry-specific editions for manufacturing, wholesale, retail, nonprofit, and professional services include relevant features without customization. The integration ecosystem is massive with thousands of apps extending functionality.
The limitations become apparent as you scale further. Performance can suffer with large transaction volumes. Advanced features like multi-entity management and dimensional reporting are limited compared to true ERP platforms. It’s also desktop-based software rather than cloud-native, which creates challenges for distributed teams.
SAP Business One brings enterprise-level capabilities to mid-market companies as a scaled-down version of SAP’s enterprise software. You get powerful functionality without the massive complexity of full SAP implementations. The system excels at integration across business functions with financials connecting seamlessly to inventory, purchasing, sales, and production.
For manufacturers and distributors, this end-to-end integration provides visibility that’s difficult to achieve with separate systems. The financial management capabilities are comprehensive with strong multi-currency handling, intercompany transaction support, and robust reporting. Compliance features help with audit trails and regulatory requirements.
SAP Business One can deploy in the cloud or on-premise, giving you flexibility based on your preferences and requirements. The challenge is finding qualified implementation partners since SAP Business One requires specialized expertise. The partner you choose significantly impacts your success. Pricing typically involves a per-user license fee around three thousand dollars plus annual maintenance.
Workday Financial Management approaches finance differently with a unified data model where HR and finance share the same core system. For companies viewing workforce planning and financial planning as interconnected, this architecture makes strategic sense. The user interface is legitimately modern and intuitive with significant investment in user experience that shows throughout the platform.
The analytics and reporting capabilities are impressive with built-in dashboards providing real-time visibility and easy drill-down from high-level metrics into transaction details. Workday is cloud-only with continuous updates, so you always have the latest features without disruptive upgrade projects.
The consideration is that Workday typically makes sense for larger organizations with the pricing reflecting enterprise positioning. Implementations usually require significant investment in both time and resources. For mid-market companies, other options often provide better value, but for larger enterprises wanting unified HR and finance systems with excellent user experience, Workday deserves evaluation.
Making your selection requires understanding your specific requirements beyond just core accounting functionality. Multi-entity consolidation needs, industry-specific features, integration requirements with existing systems, user experience priorities, and total cost of ownership all factor into which platform fits best. The detailed comparison of these platforms with real user feedback and specific feature analysis appears in our comprehensive review of the best ERP systems for finance teams that California businesses actually use.
Your implementation timeline also matters when evaluating options. If you need to be operational in three months, that eliminates platforms requiring six to nine month implementations. If you can invest adequate time for proper deployment, more choices become viable. Rushing implementation to meet arbitrary deadlines usually creates problems that cost more to fix than the time saved.
How ERP Automates Accounting: From Chaos to Compliance in 90 Days
Manual accounting processes are killing your finance team’s productivity and creating risk throughout your organization. Every invoice entered by hand is an opportunity for typos. Every bank reconciliation done manually takes hours that could go toward analysis. Every month-end close that drags on for weeks delays decisions that need current financial information.
ERP accounting automation eliminates these problems by letting computers handle repetitive tasks while your team focuses on judgment, strategy, and problem-solving. The transformation isn’t theoretical. Most California companies implementing financial ERP systems see fifty to seventy percent reduction in time spent on routine accounting tasks within ninety days of going live.
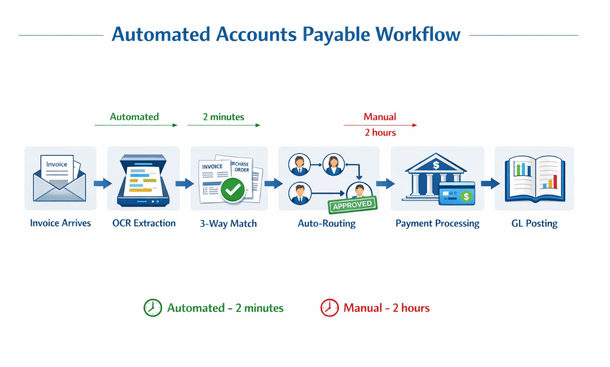
The automation starts with accounts payable. Instead of your team manually entering vendor invoices, the system captures them automatically whether they arrive via email, supplier portal, or even paper documents through scanning. Optical character recognition reads the invoice and extracts vendor name, amount, date, and line items without anyone typing numbers.
The system then matches invoices to purchase orders automatically based on rules you define. If everything aligns within your tolerance thresholds, the invoice routes for approval according to your workflow rules. Department managers receive notifications, can approve from their mobile devices, and the transaction posts to your general ledger without finance touching it. The entire process from invoice receipt to payment happens with minimal human intervention.
Accounts receivable automation works similarly by generating customer invoices automatically based on contracts, project milestones, shipping confirmations, or subscription billing rules. The system sends invoices via email, tracks when customers view them, and can send automatic payment reminders based on your preferences. Payment application happens automatically when customers pay through integrated payment portals, with cash receipts matching to open invoices and updating your accounts receivable aging in real time.
Bank reconciliation automation matches transactions from your bank feeds to entries in your general ledger based on amounts, dates, and reference numbers. The system handles straightforward matches automatically, typically resolving seventy to eighty percent of transactions without human review. It flags exceptions and unusual items for manual investigation, but the bulk of reconciliation work happens behind the scenes.
Journal entry automation handles recurring entries like depreciation, amortization, accruals, and standard allocations. You establish the rules once, and the system posts these entries automatically each period. Some advanced systems can even suggest correcting entries when they detect errors or anomalies in your financial data, helping maintain accuracy without constant manual review.
Financial close automation orchestrates your entire month-end process through task management and workflow coordination. The system generates checklists of required activities, assigns them to team members, tracks completion, and triggers dependent processes automatically. What used to require constant coordination and status meetings happens systematically with clear visibility into progress and bottlenecks.
The ninety-day implementation timeline for achieving meaningful automation is realistic for most mid-market companies when approached methodically. Month one focuses on setup and configuration including mapping your chart of accounts, defining approval workflows, standardizing vendor and customer records, and establishing rules for automated matching and posting.
Data cleanup happens during month one and deserves significant attention. Vendor records need standardization with consistent naming and proper classification. Your chart of accounts might need restructuring to support automated processes and better reporting. Historical transactions require proper coding and categorization. Clean data makes automation work smoothly while messy data creates constant exceptions and frustration.
Month two involves testing and refinement where you run parallel processes comparing automated results against manual work to verify accuracy. You’ll discover edge cases and exceptions requiring special handling. System configuration gets adjusted based on real-world testing with your actual data and transactions. This iterative refinement is essential for building confidence in automated processes.
Training happens throughout month two as your team learns new workflows, understands where they need to intervene versus letting automation handle things, and gets comfortable with the transformed processes. Good training distinguishes successful implementations from those where teams struggle and resist change. Invest adequate time ensuring everyone understands not just what buttons to push but why processes work the way they do.
Month three involves phased go-live with increasing complexity. You might start by automating vendor invoice processing for your largest, most reliable vendors before expanding to all suppliers. Customer invoicing might begin with straightforward scenarios before tackling complex revenue recognition situations. Bank reconciliation could start with your primary operating account before adding other accounts.
By day ninety, most teams have automated sixty to seventy percent of routine transactions with remaining manual work involving exceptions, complex scenarios, or edge cases requiring human judgment. The goal isn’t eliminating all manual work but rather automating what can be automated reliably so your team focuses on things that truly need their expertise.
Building workflows that actually work requires moving beyond simply replicating existing processes in software. Implementation is an opportunity to rethink how work should flow. Start by mapping current processes in detail to understand where invoices come from, who needs to approve what, and what exceptions occur regularly. This documentation reveals improvement opportunities you might otherwise miss.
Define clear approval rules based on dollar thresholds, departments, vendors, account codes, or other relevant criteria. Unambiguous rules enable automated routing without constant intervention. For example, invoices under five hundred dollars from approved vendors might not require approval at all, while anything over ten thousand dollars might need multiple sign-offs from different stakeholders.
Exception handling deserves attention from the start rather than as an afterthought. What happens when an invoice doesn’t match a purchase order? When a customer disputes a charge? When a bank transaction doesn’t match anything in your system? Design clear paths for these scenarios so they don’t become bottlenecks that hold up everything else.
Visibility for all stakeholders makes automation work smoothly. Department managers should see what requires their approval through dashboards and notifications. Finance teams need visibility into processing status and exception queues. Executives want high-level metrics on processing efficiency and cycle times. Good automation includes reporting and alerts that keep everyone informed without requiring constant status inquiries.
Common obstacles during implementation include data quality issues that surface immediately once you start automation. You’ll discover duplicate vendor records, inconsistent account coding, and incomplete information that manual processes accommodated through workarounds. Address these systematically rather than trying to fix everything simultaneously. Focus on data needed for your first automated processes, then expand coverage progressively.
Resistance from team members happens when people feel threatened by automation or worry about their roles changing. Transparency about what’s changing and why helps manage this concern. Involve people in workflow design so they feel ownership rather than having changes imposed on them. Emphasize that automation eliminates tedious work, not jobs, freeing people for more interesting and valuable activities.
Integration challenges occur when your ERP needs to exchange data with other systems like your e-commerce platform, CRM, payroll system, and banking portal. Work with vendors or implementation partners experienced with your specific integrations. Standard connectors exist for common applications, but custom integrations sometimes require development work and testing.
The impact of successful automation shows up in measurable ways beyond just time savings. Error rates typically drop by seventy to eighty percent as automated data entry eliminates typos and automated matching catches discrepancies before they become problems. Processing costs decrease when you handle growing transaction volumes without proportionally increasing headcount.
Cash flow often improves because automation accelerates processing. Customer invoices go out faster, leading to quicker payment. You can take advantage of early payment discounts when accounts payable processes efficiently. Better visibility into payables and receivables timing enables more accurate cash forecasting and working capital optimization.
Employee satisfaction usually increases as team members spend less time on tedious manual tasks and more time on interesting work requiring judgment and expertise. Nobody got into accounting because they love data entry. When your team can focus on analysis, problem-solving, and supporting business decisions, engagement and retention typically improve.
Compliance and audit readiness strengthen significantly with automation. Automated systems create complete audit trails with every transaction timestamped and tied to the user who initiated it. Supporting documentation attaches automatically. When auditors arrive or regulators ask questions, you can produce exactly what they need in minutes instead of days of manual compilation.
Advanced automation opportunities emerge once you’ve automated core processes. Expense management automation captures receipts through mobile apps, enforces policy rules automatically, and processes reimbursements without finance team involvement. Revenue recognition automation handles complex scenarios like multi-element arrangements and subscription billing while maintaining compliance with accounting standards.
Cash forecasting automation pulls data from accounts receivable, accounts payable, payroll, and other sources to project your cash position with daily updates based on actual transactions. The system can alert you to potential cash crunches before they become critical, giving you time to take corrective action.
The transformation from manual accounting processes to automated workflows is significant but completely achievable in ninety days with methodical implementation. Companies completing this journey consistently describe it as game-changing for their finance operations. The hours saved, errors eliminated, and visibility gained fundamentally alter how finance operates and contributes to business success.
Understanding the specific automation capabilities and implementation approach gives you realistic expectations for what’s possible and how to achieve it. The detailed walkthrough of implementing accounting automation with real timelines and examples from California companies appears in our comprehensive guide on ERP accounting automation that takes finance teams from chaos to compliance.
Real-Time Financial Reporting with ERP: Build Your Dashboard Strategy
Your executives make decisions based on information that’s already outdated. Board meetings involve questions that nobody can answer without promising to follow up later. Investors request metrics that take your finance team three days to compile from multiple sources.
This disconnect between when decisions need to happen and when financial information becomes available creates real problems. Opportunities get missed because leaders lack current data. Issues escalate because warning signs weren’t visible until too late. Strategic discussions get delayed waiting for reports that should take minutes, not days.
ERP financial reporting eliminates this gap by providing continuous visibility into your financial position. When done properly, stakeholders access current information anytime, analyze it from any angle they need, and answer their own questions without creating work for your finance team.
The shift from periodic reporting to real-time visibility fundamentally changes organizational behavior. Department managers make better spending decisions when they can check budget status instantly rather than waiting weeks for variance reports. Sales leaders adjust strategies immediately when daily revenue trends reveal problems rather than discovering issues at month-end. Executives spot patterns and anomalies as they develop instead of reacting to historical data.
Building effective dashboards starts with your core financial command center showing overall business health at a glance. This becomes the first place people look when they want to know how the business is performing. The metrics that belong here depend on your business model, but revenue and cash are universal starting points.
Subscription companies care intensely about monthly recurring revenue, churn rate, and customer lifetime value. Services firms track utilization rates, backlog, and revenue per employee. Manufacturers monitor gross margin by product line, inventory turns, and production efficiency. E-commerce businesses watch conversion rates, average order value, and customer acquisition costs. Your core dashboard should reflect what actually drives your specific business.
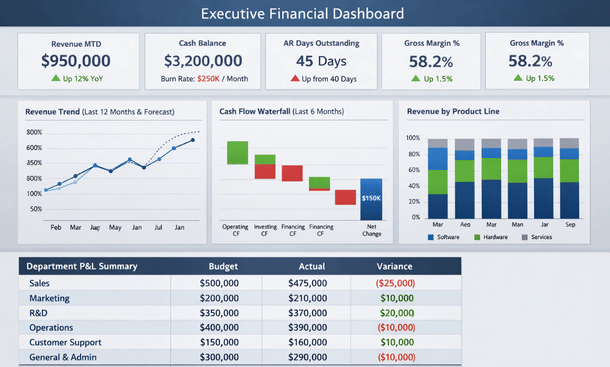
Context matters more than individual numbers. Revenue of two million dollars this month means nothing without knowing if that’s ahead of plan, behind last year, or trending in the right direction. Every metric needs comparison whether against budget, prior period, or trend line. Color coding helps communicate status instantly with green for favorable performance, red for concerning variances, and yellow for items needing attention.
Trend visualizations tell stories that tables of numbers cannot. A line chart showing revenue over twelve months reveals seasonality, growth trajectory, and inflection points at a glance. Bar charts comparing department spending show relative scale immediately. Waterfall charts illustrate how you got from starting cash to ending cash through operating activities, investments, and financing.
Keep your core dashboard focused rather than cluttered. Including too many metrics dilutes attention and overwhelms users. Aim for ten to fifteen key indicators that truly drive business performance. Everything else can live in secondary dashboards or detailed reports accessed when deeper investigation is needed.
Design for your actual usage patterns. If executives check dashboards from mobile devices between meetings, ensure key metrics are visible without scrolling or zooming. If board reviews happen on large screens during quarterly meetings, optimize the layout for that viewing experience. If department managers access dashboards from desktop computers, you have more screen real estate for detail.
Beyond company-wide views, different roles need specialized dashboards focused on their specific responsibilities. Sales leaders need pipeline visibility, bookings trends, and performance by rep, region, and product. They want to spot deals at risk, identify top performers, and understand conversion rates at each pipeline stage. Self-service access to this information reduces constant requests to finance for ad-hoc reports.
Operations dashboards monitor metrics driving service delivery or production. Project-based businesses need project profitability, resource utilization, and forecast-to-complete visibility. Manufacturers track production efficiency, quality metrics, and inventory levels. Operations managers use these dashboards to optimize processes and resource allocation in real time rather than reacting to historical reports.
Marketing dashboards connect spending to results by tracking cost per lead, customer acquisition cost, and marketing-influenced revenue. This visibility helps marketing teams optimize their investments and justify budget requests with data rather than intuition. Linking marketing metrics directly to financial outcomes strengthens the connection between activities and business results.
Department manager dashboards show budget versus actual spending with drill-down capability into line-item detail. Managers need to understand where their department stands financially without waiting for monthly variance reports from finance. When variances occur, they can investigate details themselves rather than scheduling meetings to discuss every fluctuation.
Executive dashboards provide the highest-level view with the ability to investigate deeper when something catches attention. Executives want to monitor overall performance across the business, identify issues quickly, and drill into details when necessary. The design should support both quick status checks and deeper investigation without requiring multiple separate reports.
Advanced reporting capabilities separate good financial reporting from exceptional reporting. Dimensional reporting lets you analyze financial data across multiple dimensions simultaneously. You might examine revenue by customer, by product, by region, and by sales rep all at once. This multi-dimensional analysis reveals patterns and insights that single-dimension reports miss completely.
Comparative analysis shows performance across time periods, entities, or scenarios. Year-over-year comparisons reveal growth trends and seasonality. Quarter-over-quarter analysis spots acceleration or deceleration. Actual versus forecast identifies where predictions missed and helps improve future forecasting accuracy. Budget versus actual highlights areas requiring management attention or corrective action.
Drill-down functionality starts with high-level summary metrics and lets users click through to increasing detail. Click total revenue to see revenue by customer segment. Click a specific segment to see individual customers. Click a customer to see their transaction history. This exploration capability lets stakeholders answer their own questions without creating custom report requests for finance.
Customizable views allow different users to configure dashboards for their specific needs and preferences. Your VP of Sales cares about different metrics than your VP of Operations. Letting users personalize their experience increases adoption and usefulness. Some platforms support role-based default views that can be further customized by individual users.
Automated distribution schedules reports to stakeholders on regular cadence without manual effort. Board members might receive monthly performance packages automatically. Department managers get budget variance reports every Monday morning. Executives receive daily flash reports with key metrics before the workday starts. Automation ensures consistent delivery without someone remembering to send reports manually.
Building dashboards that actually get used daily versus those that get ignored after initial excitement requires focusing on user needs rather than technical capabilities. Start by understanding what decisions your users make and what information they need to make those decisions well. Interview executives, managers, and team members about questions they’re trying to answer and challenges they face getting information today.
Design for scanning rather than reading. People glance at dashboards to get quick status updates, not to study detailed reports. Visualization, color coding, and layout should communicate information instantly. Important metrics should be prominent. Trends should be immediately apparent. Users should understand the story without reading paragraphs of text.
Update frequency should match decision-making speed. If decisions happen daily, dashboards need daily updates at minimum. For metrics requiring immediate action like cash position or critical operational indicators, real-time updates matter. For strategic metrics reviewed monthly, daily updates might suffice. Mismatched update frequency and decision cadence reduces dashboard value.
Mobile access has become essential rather than optional. Executives aren’t sitting at desks all day reviewing reports. They’re in meetings, traveling, working remotely, and moving between activities. Mobile-responsive dashboards or dedicated mobile apps ensure access regardless of location or device. The mobile experience should provide real functionality, not just stripped-down views of desktop dashboards.
Data accuracy and trust determine whether dashboards drive decisions or get ignored. The most beautiful visualization means nothing if stakeholders don’t trust the underlying numbers. Building confidence requires attention to data quality, transparency about sources, and consistency in definitions.
Establish a single source of truth for each metric. When different reports show different numbers for the same metric, trust evaporates immediately. Your ERP should be the authoritative source for financial data with clear lineage showing where numbers originate and how they’re calculated.
Document metric definitions clearly and make them accessible. What exactly counts as revenue? When does a sale get recognized? How is gross margin calculated? What gets included in operating expenses versus cost of goods sold? Written definitions prevent confusion and ensure everyone interprets metrics identically.
Reconcile dashboard numbers to official financial statements regularly. Your real-time dashboards might use slightly different timing, accruals, or classification than formal GAAP financials. Document these differences and reconcile them monthly so users understand any variances between dashboard numbers and audited statements.
Complex reporting scenarios become more common as businesses grow. Multi-entity consolidation combines financial results from multiple legal entities while eliminating intercompany transactions. Your dashboards should show both consolidated company-wide views and individual entity performance with easy navigation between levels.
Multi-currency reporting matters for companies with international operations. Dashboards should display amounts in both transaction currency and reporting currency with clear indication of exchange rates used. Users need visibility into whether performance changes reflect operational results or currency movements.
Project-based reporting tracks profitability at the project level for services businesses. Dashboards show revenue, costs, and margin by project with visibility into remaining budget and forecast to complete. Project managers need this information to deliver profitably while finance needs it for accurate revenue recognition and forecasting.
Integration with operational systems creates the most powerful financial dashboards by combining ERP data with information from CRM, project management, inventory systems, and other operational platforms. This integrated view connects financial outcomes to operational drivers, helping leaders understand what activities produce which results.
The dashboard strategy you build today should support your company through years of growth. Take time to design thoughtfully, involve the right stakeholders, and build on solid technical foundation. Your investment in financial reporting pays dividends every time someone makes a better decision because they had the right information at the right time.
Understanding how to build dashboards that deliver real-time visibility and actually get used requires seeing examples and understanding best practices developed through real implementations. The detailed guide on creating financial dashboards and reporting strategies that California finance teams rely on appears in our comprehensive resource on ERP financial reporting and dashboard development.
Your finance operation either enables growth or constrains it. There’s no middle ground. Companies trying to scale with fragmented accounting software, manual processes, and periodic reporting hit walls that prevent them from executing on opportunities. Meanwhile, businesses that invest in proper financial ERP infrastructure scale smoothly because their systems grow with them instead of holding them back.
The transformation from traditional accounting to integrated financial ERP isn’t just about software. It’s about fundamentally changing how your organization generates, accesses, and uses financial information. When data flows automatically between systems, when routine tasks happen without manual intervention, when stakeholders get real-time visibility into metrics that matter, everything changes.
Your finance team stops being order takers who spend their time compiling reports and starts being strategic partners who help business leaders make better decisions. Your executives stop making decisions based on outdated information and start acting on current data. Your investors stop asking for information you can’t produce quickly and start getting transparency that builds confidence.
California’s business environment rewards companies that move fast with accurate information. Your competitors are implementing these capabilities right now. The gap between companies with modern financial infrastructure and those still running on legacy systems widens every quarter. This isn’t about keeping up with trends. It’s about building the operational foundation required to compete effectively.
The implementation journey takes commitment. You’ll invest months of effort and significant budget. Your team will need to learn new systems and adapt to different workflows. There will be challenging moments during implementation when you question whether the disruption is worth it. Every company that’s completed this transformation successfully will tell you the same thing: they only wish they’d done it sooner.
Starting this journey requires understanding where you are today and where you need to be. Document your current pain points honestly. Where does your finance team spend the most time? What manual processes create risk or consume resources? What questions from stakeholders can’t you answer quickly? What’s preventing you from closing faster, reporting better, or scaling efficiently?
Talk to your finance leaders, department managers, and executives about what they need. Their requirements should drive your evaluation, not vendor marketing materials or feature checklists. If you don’t have a CFO yet, that’s actually a strong signal you need ERP systems even more since these platforms build in financial controls and best practices automatically.
Research platforms that fit your size, industry, and specific requirements. A twenty-person startup has different needs than a two-hundred-person manufacturer. Take advantage of vendor demos and trials to see systems in action with your own eyes. Bring your finance team into the evaluation process since they’ll be the ones working in the system daily.
Budget for total cost of ownership including not just software subscriptions but implementation services, training, data migration, and ongoing optimization. The cheapest option upfront often costs more over time through inadequate functionality or expensive customizations. Focus on value delivered rather than minimizing initial investment.
Plan for adequate implementation time. Rushing to meet arbitrary deadlines usually creates problems that cost more to fix than the time saved. Most successful implementations take three to six months for mid-market companies, with larger organizations requiring longer timelines. Phased approaches that implement core functionality first then expand capabilities over time often work better than trying to do everything simultaneously.
Commit resources from your team for implementation success. Your finance staff will need time for system configuration, testing, training, and process documentation. Skimping on implementation to save money usually extends timelines and produces suboptimal results. Treat implementation as a critical project deserving proper attention and resources.
The goal isn’t perfection on day one. Your first implementation gets you to good, establishing the foundation for continuous improvement. Over time, you’ll identify additional automation opportunities, refine workflows, enhance reporting, and expand capabilities. Treat financial ERP as an evolving platform that grows with your business, not a one-time project with a fixed endpoint.
For California businesses dealing with growth, complexity, or the limitations of outdated systems, the question isn’t whether to implement financial ERP but when and how. The longer you wait, the bigger the gap between where you are and where you need to be. The technical debt accumulates. The workarounds multiply. The risk increases.
Companies that make this transition successfully share common characteristics. They treat it as a change management initiative, not just a technology project. They invest in proper planning and design upfront. They involve end users throughout the process. They commit to training and adoption. They measure results and optimize continuously.
Your journey starts with education and evaluation, moves through careful selection and thorough implementation, and continues with ongoing optimization and expansion. Each phase builds on the previous one. Each milestone brings measurable improvements to how your finance operation performs.
The financial ERP capabilities we’ve covered throughout this guide work together to create a complete modern finance operation. Understanding what financial systems can do, evaluating which platforms fit your needs, implementing automation that eliminates manual work, and building reporting that provides real-time visibility all combine to transform how your finance function operates and contributes to business success.
If you’re ready to take the first concrete step toward automation and want to understand exactly how to implement these systems to eliminate manual processes and accelerate your accounting cycles, our detailed implementation guide on ERP accounting automation provides the roadmap California finance teams follow to achieve transformation in ninety days.
About the Author

mike
Mike is a tech enthusiast passionate about SaaS innovation and digital growth. He explores emerging technologies and helps businesses scale through smart software solutions.
Did you find this helpful?
Your feedback helps us curate better content for the community.