
There’s traditional reporting, and then there’s real-time ERP analytics—and trust me, the difference is like comparing a Prius to a Tesla. Bay Area companies aren’t waiting until month-end to understand what’s happening in their business; they’re getting live insights that let them pivot on a dime and capitalize on opportunities while competitors are still crunching last quarter’s numbers. This shift from backward-looking reports to instant, actionable intelligence represents exactly how modern entrepreneurs are transforming raw data into competitive advantages. Let me show you how companies right here in California are using real-time dashboards to make decisions that literally change their trajectory.
Understanding what real-time actually means
Before we dive deeper, let’s get clear on what real-time analytics actually is, because there’s a lot of confusion and marketing hype around this term.
True real-time means your dashboards update within seconds of a transaction occurring. Someone places an order on your website, and your revenue dashboard ticks up immediately. A customer support ticket gets resolved, and your service metrics update instantly. Your inventory moves, and the system reflects it before you’ve finished scanning the barcode.
Near real-time usually means updates happen every few minutes. The system batches changes and refreshes dashboards every five or ten minutes. For most business purposes, this is functionally equivalent to true real-time and it’s what most platforms actually deliver when they say “real-time.”
Then there’s fast batch processing, where updates happen every hour or every few hours. This is way better than daily or weekly reporting, but it’s not what people mean when they talk about real-time analytics. There’s a meaningful difference between seeing yesterday’s results and seeing this hour’s results.
The key question isn’t whether you need true microsecond updates. It’s whether the delay between something happening and you knowing about it creates missed opportunities or unmanaged risks. That’s what determines how real-time you actually need to be.
The competitive advantage of instant visibility
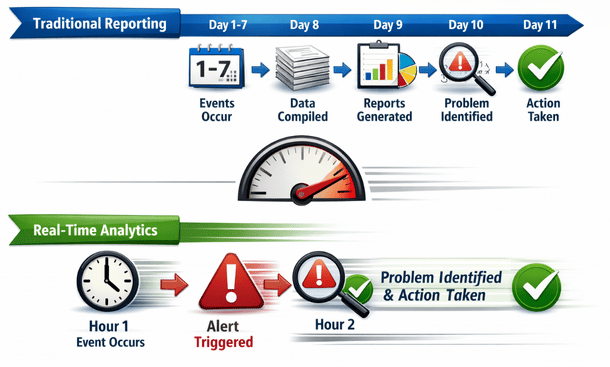
Let me tell you about a conversation I had with a founder running an e-commerce business in San Jose. Before implementing real-time analytics, they’d review sales performance every Monday morning based on the previous week’s data. By the time they identified problems or opportunities, days had passed and the moment was gone.
After switching to real-time dashboards, everything changed. They noticed a spike in abandoned carts on mobile devices one Tuesday afternoon. Within an hour, they’d identified a checkout page bug that was only affecting certain phone models. They pushed a fix that same day. The old system would have let that bug kill conversions for an entire week before anyone even noticed.
That’s the power of instant visibility. You’re not just seeing what happened. You’re seeing what’s happening right now, while you still have time to do something about it.
Real-time analytics turns reactive management into proactive management. Instead of explaining why numbers were bad last month, you’re preventing bad numbers from happening in the first place. Instead of analyzing why you ran out of inventory, you’re reordering before the stockout occurs.
Industries and scenarios where real-time matters most
Real-time analytics isn’t equally valuable for every business. Some industries and situations benefit way more than others, and understanding where you fall helps you decide how much to invest in real-time capabilities.
E-commerce businesses get massive value from real-time data. Conversion rates, traffic sources, product performance, and cart abandonment all change throughout the day. Catching issues immediately can save thousands of dollars in lost revenue. Running flash sales or limited-time promotions without real-time visibility is basically flying blind.
SaaS companies with usage-based pricing or freemium models need real-time user engagement data. Which features are people using right now? Where are they getting stuck? Who just hit their usage limits and might upgrade? These insights lose value fast if you’re looking at them days later.
Manufacturing and distribution operations benefit hugely from real-time supply chain visibility. Knowing exactly where inventory is, what’s being produced, and what’s being shipped lets you respond to disruptions immediately instead of discovering problems after commitments have been missed.
Service businesses with high customer interaction volume need real-time customer satisfaction and operational metrics. Average response times, ticket backlogs, customer sentiment, and resource utilization all require immediate attention when they start trending the wrong way.
Financial services can’t function without real-time data. Transaction monitoring, fraud detection, portfolio performance, and risk management all require instant information. Even small delays can result in massive losses or compliance issues.
On the flip side, businesses with slower sales cycles or less volatile operations might not need real-time dashboards. If you’re a B2B company with quarterly sales cycles and deals that take months to close, daily updates might be perfectly sufficient.
Building the infrastructure for real-time analytics
Getting to real-time analytics requires more than just turning on a feature in your software. You need the right technical foundation, and understanding what that looks like helps you plan your implementation.
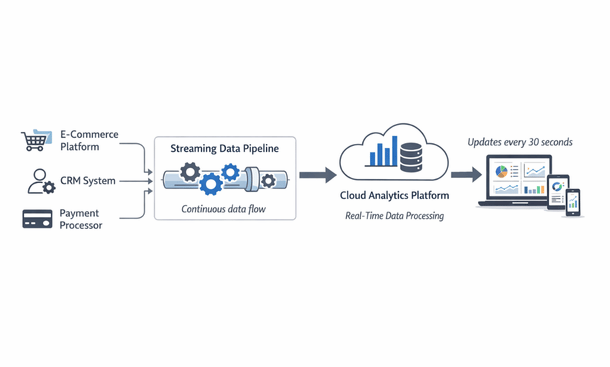
Your data sources need to support real-time data streaming. Legacy systems that only export data in batch processes at night won’t cut it. You need systems with APIs or database change feeds that can push updates as they happen.
Your analytics platform needs to handle high-frequency data ingestion without choking. Some tools are built for real-time processing with in-memory databases and optimized query engines. Others bog down when you try to update dashboards every few seconds. This is a critical consideration when choosing your platform.
Your data pipeline needs to be designed for streaming rather than batching. Traditional ETL processes that extract, transform, and load data on schedules don’t work for real-time scenarios. You need continuous data flows with transformations happening on the fly.
Your dashboards need to auto-refresh without requiring manual page reloads. Sounds basic, but you’d be surprised how many analytics tools require you to hit refresh to see new data. For real-time monitoring, dashboards should update automatically at whatever interval makes sense.
The good news is that modern cloud-based analytics platforms handle most of this infrastructure automatically. You’re not building real-time data pipelines from scratch unless you have very specific or complex requirements.
Critical metrics that demand real-time monitoring
Not every metric needs real-time updates, but certain ones absolutely do. Understanding which metrics fall into this category helps you prioritize your real-time analytics implementation.
Cash position and daily cash flow should always be real-time if possible. Running out of cash is an existential threat, and you need to see it coming with enough time to take action. Real-time visibility into receivables, payables, and bank balances gives you that runway.
Customer-facing issues like website uptime, page load speeds, and checkout completion rates need immediate monitoring. Every minute your site is slow or broken is lost revenue. Real-time alerts let you address problems before they become disasters.
Inventory levels for high-velocity products should update continuously. Stockouts kill momentum and disappoint customers. Overstocks tie up cash and create storage problems. Real-time inventory visibility lets you maintain that sweet spot.
Marketing campaign performance during active promotions needs real-time tracking. If your Facebook ads are crushing it, you want to increase spend today, not next week after you’ve missed the opportunity. If they’re tanking, you want to pause them immediately.
Customer service metrics like response times and ticket backlogs should be real-time. Service level agreements often have hourly requirements, and you can’t manage to SLAs if you’re looking at yesterday’s data.
Production metrics in manufacturing environments need continuous monitoring. Equipment downtime, quality issues, and throughput problems compound quickly. The faster you spot them, the less they cost you.
Fraud indicators and security alerts have to be real-time. By definition, you can’t afford delays in detecting and responding to fraudulent activity or security breaches.
Real-time alerts and automated responses
The real power of real-time analytics isn’t just seeing what’s happening now. It’s having the system automatically notify you when attention is needed and sometimes even take corrective action without human intervention.
Threshold alerts are the foundation. You define acceptable ranges for critical metrics, and the system alerts you when something falls outside those bounds. Revenue per hour drops below $X, alert. Cart abandonment rate exceeds Y percent, alert. Inventory falls below Z units, alert.
Anomaly detection goes a step further by using machine learning to identify unusual patterns even when they don’t cross pre-defined thresholds. Maybe revenue is within normal ranges but the mix of products selling is weird. Maybe customer support tickets are at normal volumes but sentiment is unusually negative. These subtle signals often indicate problems before they show up in the obvious metrics.
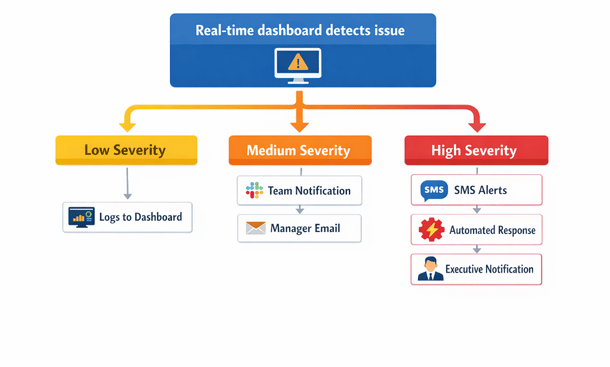
Escalation workflows ensure the right people get involved at the right time. A minor issue might just log to a dashboard. A moderate issue sends a Slack message to the team. A critical issue sends SMS alerts to managers and executives. You don’t want to be the founder who missed a major problem because the alert got buried in email.
Automated responses take this even further. When certain conditions trigger, the system can automatically take action. Inventory hits reorder point, system automatically generates a purchase order. Website performance degrades, system automatically scales up server capacity. Campaign hits daily budget limit, system automatically pauses ad spend.
The key is finding the right balance. Too few alerts and you miss important issues. Too many alerts and people start ignoring them all. Start conservative with only critical alerts, then expand gradually based on what you learn.
Case studies from Bay Area companies
Let me share some real examples of how companies in the Bay Area are using real-time analytics to gain competitive advantages. These stories illustrate the practical impact better than any theoretical explanation.
A San Francisco SaaS company was losing customers during their onboarding process but didn’t know exactly where or why. After implementing real-time user behavior tracking, they discovered that users who didn’t complete a specific setup step within their first hour were 80 percent more likely to churn. They built an automated system that triggered a helpful email and offered a live chat within 45 minutes if that step wasn’t completed. Their activation rate jumped 35 percent.
An Oakland-based distribution company was constantly firefighting inventory issues. By the time they knew they were running low on a product, it was too late to reorder without causing stockouts. Real-time inventory tracking integrated with their sales velocity metrics now predicts stockouts three days in advance and automatically generates reorder recommendations. Their stockout rate dropped from 12 percent to under 2 percent.
A San Jose e-commerce company uses real-time pricing analytics to adjust margins dynamically based on demand, competition, and inventory levels. When they spot a competitor running out of stock on a hot item, they can capitalize on increased demand within hours instead of days. This dynamic approach increased their gross margin by 4 percentage points without hurting conversion rates.
A Palo Alto consulting firm implemented real-time project profitability tracking. Previously, they’d discover projects were over budget weeks after the fact. Now, project managers get alerts when burn rates exceed projections, allowing them to adjust resource allocation or have scope conversations with clients while there’s still time to correct course. Project profitability improved by 18 percent.
These aren’t massive enterprises with unlimited budgets. These are businesses with 20 to 200 employees who made smart investments in real-time analytics and saw measurable returns.
The psychological impact of real-time visibility
There’s an underrated benefit of real-time analytics that goes beyond the tactical advantages. It fundamentally changes how entrepreneurs and their teams think about and engage with their business.
When you only see data weekly or monthly, you develop a disconnected relationship with your numbers. They feel historical and abstract. When you see data updating in real-time, it becomes visceral and immediate. You start to understand cause and effect in ways that aren’t possible with delayed reporting.
I’ve noticed that founders with real-time dashboards check them habitually, almost compulsively. Not because they’re anxious, but because the data is engaging. It’s like watching a game in progress versus reading about it after it’s over. The real-time nature makes it interesting and relevant.
This increased engagement leads to better business intuition. When you see the immediate impact of your decisions reflected in the data, you develop a much sharper sense of what works and what doesn’t. You start to internalize patterns and relationships that would take years to notice with slower reporting cycles.
There’s also a motivational aspect. Watching revenue tick up in real-time as you execute a successful promotion is satisfying in ways that reviewing last month’s report never is. Seeing problems get resolved immediately after you take action creates positive reinforcement loops.
The downside is that real-time visibility can become addictive in unhealthy ways. Some founders start obsessively checking dashboards dozens of times per day, which isn’t productive. The key is finding the balance between staying informed and staying focused on the work that actually moves the needle.
Implementing real-time analytics without disrupting operations
The transition from traditional reporting to real-time analytics can feel daunting, especially if you’re worried about disrupting current operations. Here’s how to approach implementation in a way that minimizes risk and maximizes adoption.
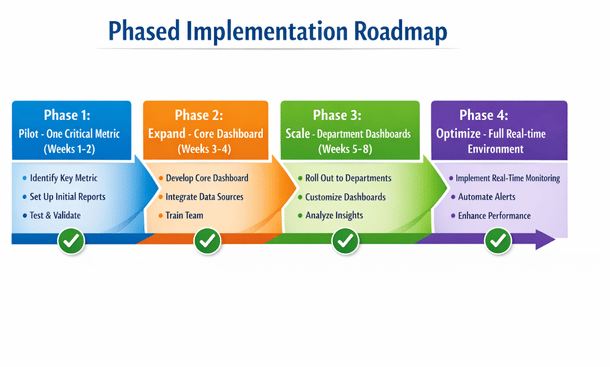
Start with one high-value metric or dashboard. Don’t try to make everything real-time simultaneously. Pick the single metric where real-time visibility would be most valuable, get that working smoothly, and let your team get comfortable with it before expanding.
Run parallel systems during the transition. Keep your existing reporting processes in place while you build out real-time capabilities. This gives you a safety net and lets you verify that the real-time data matches your established reports before you fully switch over.
Involve the people who will use the dashboards in the design process. The operations manager who needs real-time inventory visibility probably has strong opinions about how that dashboard should look and what alerts matter most. Building with them rather than for them dramatically increases adoption.
Plan for a learning curve. Real-time data reveals things that were invisible before, and sometimes those things are uncomfortable. Your team might discover inefficiencies or problems that were previously hidden in monthly aggregates. Frame this as an opportunity for improvement rather than a blame exercise.
Establish response protocols before you implement alerts. If you’re going to get notified when something goes wrong, make sure everyone knows who’s responsible for responding and what actions to take. Alerts without clear ownership and processes create stress without value.
Cost considerations and ROI calculations
Real-time analytics typically costs more than traditional batch reporting, both in terms of software licensing and infrastructure. Understanding the economics helps you make informed decisions about where to invest.
Most analytics platforms charge more for real-time capabilities. The computational resources required for continuous processing and streaming data are higher than batch processes. Expect to pay 20 to 50 percent more for real-time features compared to standard reporting tiers.
The ROI calculation needs to focus on what real-time visibility enables. Can you catch problems hours or days earlier? What’s the cost of those problems if they go unaddressed? Can you capitalize on opportunities faster? What’s the value of those opportunities?
For the San Jose e-commerce company I mentioned earlier, preventing that checkout bug for one week would have saved roughly $15,000 in lost revenue. Their real-time analytics platform costs $500 per month. Catching just one issue like that per quarter makes the investment worthwhile.
For operations-heavy businesses, the ROI often comes from efficiency improvements. Reducing stockouts, optimizing inventory levels, improving resource utilization. These benefits accumulate daily and compound over time.
For customer-facing businesses, the ROI shows up in improved customer experience metrics. Faster issue resolution, more personalized interactions, proactive support. These translate into higher retention and lifetime value.
Don’t forget to factor in the time savings. If real-time dashboards eliminate manual reporting work that was taking your team five hours per week, that’s 260 hours per year you’ve freed up for higher-value activities.
Common pitfalls and how to avoid them
Having watched numerous implementations of real-time analytics, I’ve seen the same mistakes repeatedly. Learning from these common pitfalls saves you time, money, and frustration.
Pitfall one is over-monitoring low-value metrics. Just because you can track something in real-time doesn’t mean you should. Every real-time metric adds complexity and costs. Focus on the metrics where real-time visibility creates actionable advantages.
Pitfall two is alert fatigue. When everything triggers an alert, nothing gets attention. Be ruthless about setting alert thresholds high enough that alerts indicate genuine issues requiring immediate response. You can always adjust them down later if you’re missing important signals.
Pitfall three is neglecting data quality. Real-time analytics amplifies data quality issues because bad data gets exposed and acted upon immediately instead of being caught in review processes. Make sure your source systems are generating accurate, complete data before you start making real-time decisions based on it.
Pitfall four is building real-time dashboards that aren’t actually actionable. If seeing a problem in real-time doesn’t enable you to respond any differently than you would with delayed data, you’re investing in capability you don’t need. Every real-time metric should have a clear answer to “what action do we take when this changes?”
Pitfall five is ignoring mobile access. Real-time dashboards are most valuable when you can access them anywhere, anytime. If your dashboards only work well on a desktop computer, you’re limiting their utility significantly.
The future of real-time analytics in business
Looking at where the technology is heading helps you make smarter investments today that will position you well for tomorrow.
AI-powered predictive alerts are becoming mainstream. Instead of just telling you what’s happening right now, systems are increasingly able to predict what’s about to happen and alert you proactively. This shifts real-time analytics from reactive to predictive.
Embedded analytics are making real-time data available within the workflow tools people already use. Instead of switching to a separate dashboard, you’ll see relevant real-time metrics directly in Slack, email, or whatever application you’re already working in.
Natural language interfaces are making real-time analytics more accessible. Instead of building a dashboard, you’ll ask questions in plain English and get instant answers with visualizations generated on the fly.
Edge computing is enabling real-time analytics in environments where cloud connectivity is limited or slow. Manufacturing floors, retail stores, and field operations can process and act on data locally without round-trips to central servers.
The democratization of real-time analytics means capabilities that required six-figure investments just a few years ago are now accessible to businesses of any size. This levels the playing field and makes real-time visibility a competitive necessity rather than a luxury.
Avoiding costly mistakes in your analytics journey
You’ve now got a solid understanding of how real-time ERP analytics can transform your decision-making speed and quality. But even with the best real-time systems in place, there are critical mistakes that can derail your entire analytics strategy and waste tens of thousands of dollars.
Want to protect your investment and avoid the pitfalls that trip up most California entrepreneurs? Head over to our guide on ERP analytics mistakes that cost businesses $50K and how to avoid them. And for the complete roadmap that ties all these concepts together, check out our comprehensive ERP analytics guide for California entrepreneurs.
About the Author

mike
Mike is a tech enthusiast passionate about SaaS innovation and digital growth. He explores emerging technologies and helps businesses scale through smart software solutions.
Did you find this helpful?
Your feedback helps us curate better content for the community.