
Running a business in California without solid analytics is like surfing with your eyes closed. Sure, you might catch a wave or two by luck, but you’re missing all the signals that separate good runs from wipeouts. The entrepreneurs who are crushing it right now aren’t just working harder—they’re working smarter by turning the data already sitting in their systems into actionable intelligence that drives real growth.
ERP analytics has moved from enterprise luxury to startup necessity faster than most people realize. What used to require six-figure investments and teams of data scientists is now accessible to any entrepreneur willing to take their business seriously. The gap between companies that leverage their data and those that don’t is widening every quarter, and honestly, that gap represents the difference between scaling smoothly and constantly firefighting problems you should have seen coming.
This guide walks you through everything you need to know about ERP analytics specifically for California entrepreneurs. We’re not talking theory here. This is the practical stuff I’ve learned from working with dozens of founders across the Bay Area, LA, San Diego, and everywhere in between. Whether you’re running a bootstrapped SaaS startup in Oakland or a venture-backed e-commerce company in Orange County, the principles and practices here will help you transform how you understand and run your business.
What ERP analytics actually means for your business
The term ERP analytics gets thrown around constantly, but most entrepreneurs don’t have a clear picture of what it actually is or why it matters beyond sounding tech-savvy at networking events. Stripping away the buzzwords, ERP analytics is simply the process of taking all the data your business generates through its core operations and turning it into insights that help you make better decisions.
Your ERP system, whether that’s QuickBooks, NetSuite, SAP, or any other platform, already collects information about every transaction, every inventory movement, every customer interaction, every expense. That data just sits there doing nothing unless you have a way to analyze it, visualize it, and extract meaning from it. That’s where analytics comes in.
Think of your business data like crude oil. It has potential value, but it’s not useful in its raw form. Analytics is the refinery that transforms that crude data into high-octane fuel you can actually use to power decisions. Should you expand your product line? Which marketing channels deliver the best ROI? Where are you bleeding cash? Which customers are most profitable? These questions all have answers hiding in your data, and analytics is how you extract them.
The difference between basic reporting and true analytics matters here. Reports tell you what happened—your revenue last month was X, your expenses were Y, your inventory turnover was Z. Those are facts, and they’re useful, but they’re backward-looking. Analytics goes deeper by helping you understand why things happened and what’s likely to happen next. It connects patterns, identifies correlations, and enables predictive insights that change how you operate.
For California startups specifically, ERP analytics addresses challenges that are particularly acute in our competitive, fast-moving ecosystem. The cost of living is high, which means inefficiency is expensive. The talent market is competitive, which means you need to make smart hiring and resource decisions. Customer acquisition costs keep climbing, which means you need to know exactly which channels and segments deliver real value. The pace of change is relentless, which means you can’t afford to wait weeks or months to understand what’s working.
When you implement ERP analytics properly, you shift from managing your business based on gut feelings and delayed reports to making data-informed decisions in real time. You catch problems while they’re still small. You spot opportunities while there’s still time to capitalize on them. You understand your unit economics well enough to scale profitably instead of just scaling.
The psychological shift that comes with solid analytics is underrated too. There’s something deeply satisfying about replacing uncertainty with clarity. Instead of wondering whether your business is healthy, you know. Instead of worrying about cash flow, you can see exactly when issues will arise and plan accordingly. That confidence changes how you show up as a leader and how aggressively you can pursue growth.
Modern ERP analytics platforms have made this capability accessible to businesses of any size. You don’t need a dedicated data team or specialized technical skills anymore. The tools have evolved to the point where any motivated entrepreneur can implement analytics that would have required enterprise resources just five years ago. That democratization is creating a new competitive baseline where having good analytics isn’t a differentiator—not having them is a serious handicap.
Understanding what successful entrepreneurs are doing with analytics platforms creates context for everything else in this guide. The fundamentals matter more than the specific tools, but seeing the full picture helps you grasp why these capabilities are worth investing in. Our detailed exploration of what ERP analytics is and why startups need it breaks down these concepts even further if you want to build that foundational knowledge before moving forward.
Choosing the right ERP analytics tools
The analytics platform you choose determines everything that comes after, so getting this decision right matters enormously. The good news is that the market has matured to the point where there are solid options at every price point and technical level. The challenge is cutting through the marketing noise to find the tool that actually fits your specific situation.
Starting with budget constraints makes sense because there’s no point falling in love with a $50,000 per year enterprise platform when you’ve got $500 per month to spend. Analytics tools range from free options with limited features up to six-figure implementations with white-glove service. Most California startups find their sweet spot somewhere between $300 and $2,000 per month depending on their size and complexity.
Microsoft Power BI has become incredibly popular in the startup scene because it hits a great balance of capability and cost. The Pro version runs about $10 per user monthly, and it connects to basically everything. The interface takes a bit of learning, but there are tons of tutorials and templates available. If you’re already using Microsoft products, Power BI integrates beautifully. The main downside is that it can feel overwhelming at first because it’s so feature-rich.
Tableau built its reputation on visualization capabilities that make your data genuinely beautiful. When you need to present to investors or board members, Tableau dashboards have that polish that makes people lean in and pay attention. The tradeoff is cost—you’re looking at $70+ per user monthly—and a steeper learning curve. For companies where data presentation is as important as data analysis, that premium makes sense.
Zoho Analytics occupies the budget-friendly end of the spectrum at around $24 monthly for basic plans. It’s perfect for early-stage companies that need functional analytics without breaking the bank. You won’t get the advanced features or stunning visualizations of premium tools, but you’ll get 80 percent of what most businesses need. The AI assistant feature is surprisingly useful for building queries without technical knowledge.
Looker, now owned by Google, is designed specifically for companies running modern cloud data warehouses. If your data lives in BigQuery, Snowflake, or Redshift, Looker deserves serious consideration. The semantic modeling layer ensures everyone in your company works from consistent definitions, which prevents those annoying arguments about how metrics are calculated. The catch is that setup requires technical expertise, so this makes more sense for venture-backed companies with engineering resources.
Sisense handles complex data environments better than most alternatives. If your business data is scattered across a dozen different systems and you need serious processing power, Sisense delivers. The In-Chip technology makes dashboards load incredibly fast even with massive datasets. The embedded analytics capabilities are perfect if you want to white-label reporting for clients or include analytics in your product. Pricing is enterprise-focused though, so this fits better for Series A and beyond.
Integration capabilities often end up being the deciding factor. You might love a platform’s features, but if it doesn’t connect cleanly to QuickBooks, Salesforce, Shopify, or whatever systems actually run your business, you’re signing up for pain. Before committing to any tool, literally list every software application that contains important business data, then verify that your chosen analytics platform has native integrations or at least solid API access to those systems.
The mobile experience deserves way more attention than most founders give it during evaluation. You’re going to check your analytics on your phone constantly—between meetings, during your commute, while grabbing coffee. If the mobile app or responsive web interface is clunky, you’ll engage with your data way less than you should. Test the mobile experience thoroughly with real dashboards before making a final decision.
Scalability matters even if you’re small today. The last thing you want is to nail your analytics implementation, get your team using it daily, and then hit limits that force a painful migration in 18 months. Make sure whatever platform you choose can grow with you in terms of data volume, user count, and feature requirements. Most cloud platforms scale smoothly, but it’s worth confirming before signing a long-term contract.
The community and support ecosystem around a platform impacts your success more than you’d think. Platforms with active user communities, extensive documentation, and plenty of tutorials make learning easier and troubleshooting faster. Platforms with small user bases might leave you stuck when you hit issues. Check forums, look for YouTube tutorials, and see how responsive the vendor’s support team is during your evaluation process.
Some California entrepreneurs get paralyzed trying to make the perfect choice. The reality is that any of the major platforms will work fine if you implement them properly. The bigger risk is spending three months evaluating every option instead of getting started with something good enough. Pick two or three platforms that fit your budget and requirements, sign up for free trials, and actually build the same dashboard in each using your real data. Whichever feels most natural and delivers the insights you need without making you work too hard for them is probably the right choice.
The platform decision isn’t permanent either. Yeah, switching costs exist, but they’re not insurmountable. If you choose a tool and discover six months later that it’s not working, you can migrate. That’s way better than delaying your entire analytics journey because you’re afraid of making the wrong choice. Done beats perfect every single time.
Getting deeper into the specific strengths and weaknesses of leading platforms helps you match your needs to the right tool. The comparison of top ERP analytics tools California entrepreneurs use provides detailed breakdowns of pricing, features, and ideal use cases for each major option.
Setting up dashboards that drive revenue
Buying the platform is honestly the easy part. The real work starts when you’re staring at a blank canvas wondering what dashboards to build and how to make them actually useful instead of just pretty. This is where most implementations either take off or stall out, and the difference comes down to approaching setup strategically instead of randomly.
The biggest mistake founders make is jumping straight into the software and starting to drag charts around without any plan. You end up with dashboards that look busy but don’t actually help you make better decisions. Before you open your analytics platform, grab a notebook and get clear on what you’re trying to accomplish.
Start by listing your top three business priorities right now. Not what you wish they were or what they should be—what they actually are today. Maybe you’re fighting to improve cash flow. Maybe you’re trying to scale customer acquisition profitably. Maybe you’re launching a new product line and need to understand early traction. Whatever your real priorities are, write them down.
For each priority, identify the specific metrics that would help you make better decisions. If cash flow is priority one, you need accounts receivable aging, burn rate, runway calculations, and payment collection rates. If profitable customer acquisition is the goal, you need CAC by channel, LTV by customer segment, conversion rates through your funnel, and cohort retention analysis.
This exercise transforms dashboard design from overwhelming to straightforward. You’re not trying to visualize everything—you’re building the three to five dashboards that directly support your current business priorities. Everything else can wait.
Most businesses benefit from a core set of dashboard types that cover different aspects of operations. Your executive overview dashboard is the one you check every morning with your coffee. Keep it simple—revenue, expenses, profit, cash position, and maybe two or three KPIs specific to your business model. You should be able to glance at this in 30 seconds and know if your business is healthy.
Sales and revenue dashboards track where money is coming from and where opportunities exist. Include revenue by product line, customer segment, and sales rep. Show conversion rates through your funnel, average deal size, and sales cycle length. This dashboard helps you understand not just how much you’re selling but why some things sell better than others.
Operational dashboards vary by business model but they track whether daily operations run smoothly. E-commerce companies need inventory levels, fulfillment times, and return rates. SaaS businesses need user engagement, feature adoption, and support ticket volume. Service companies need utilization rates, project profitability, and delivery timelines. Whatever keeps your business running day-to-day deserves its own operational dashboard.
Financial health monitoring requires its own dedicated view. Cash flow projections, accounts payable and receivable, expense trends by category, and budget versus actual comparisons belong here. This is the dashboard that keeps you from running out of money or overspending in areas that don’t drive growth.
Customer analytics deserve focused attention because understanding who buys from you and why transforms marketing and product development. Track customer acquisition cost, lifetime value, churn rate, retention cohorts, and satisfaction scores. When you know which customer segments are most valuable and what keeps them around, you can focus resources where they’ll deliver the best returns.
Connecting your data sources properly is more straightforward than most founders expect but it still requires attention to detail. Native integrations are always your first choice. Most modern analytics platforms have pre-built connectors for popular systems like QuickBooks, Salesforce, Shopify, and Google Analytics. You literally just enter credentials, authorize the connection, and data starts flowing automatically.
API connections come into play when native integrations don’t exist. This requires some technical knowledge or a few hours with a developer, but it’s not rocket science. Your analytics platform makes scheduled API calls to pull data from your other systems. The key is establishing appropriate refresh schedules—some metrics need real-time updates while others can refresh daily or weekly.
Database connections give you maximum flexibility if your data lives in SQL databases or data warehouses. You connect directly and write custom queries to pull exactly what you need. This requires SQL knowledge but it unlocks powerful capabilities for complex data requirements.
One aspect that trips people up is data refresh frequency. Real-time refreshes consume more resources and can slow dashboards down, so be strategic about what actually needs constant updates. Current inventory and today’s revenue might need real-time refresh. Monthly financial reports can update daily. Quarterly trend analysis can refresh weekly. Match your refresh rates to how the data actually gets used.
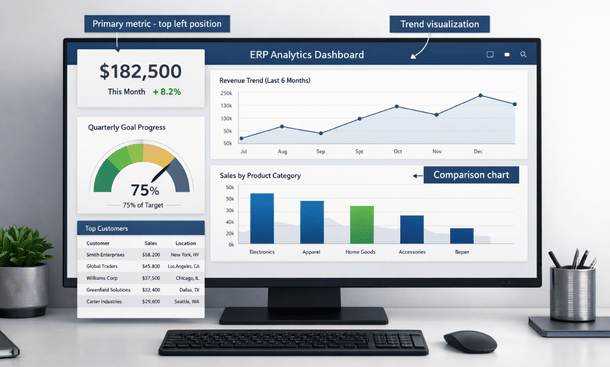
Dashboard design principles separate useful analytics from pretty wallpaper. Put your most important metric at the top left where eyes naturally go first. That’s prime real estate for your north star metric—the number that matters most to your business right now.
Use color strategically, not decoratively. Red means bad, green means good, yellow means caution. Keep it that simple. Don’t make people decode what purple or teal mean. Too many colors create visual noise that makes dashboards harder to read.
Every metric needs context. A number without comparison is meaningless. If revenue is $50,000 this month, is that good or bad? Show it compared to last month, compared to your goal, compared to the same month last year. Give people the reference points they need to interpret data correctly.
Limit each dashboard to five to seven key visualizations. More than that overwhelms people and they stop looking because it takes too much mental energy to process. If you need to show more information, create multiple focused dashboards rather than cramming everything onto one screen.
Choose the right visualization type for each metric. Line graphs show trends over time—perfect for revenue growth, website traffic, or any metric where you want to see whether something is trending up, down, or flat. Bar charts compare different categories at a single point in time—revenue by product line, sales by region, expenses by department. Pie charts work for showing parts of a whole but only when you have three to five segments maximum. Gauge charts and KPI cards display single metrics and progress toward goals. Tables provide exact numbers when precision matters more than quick comprehension.
Interactive features like filters and drill-downs transform static dashboards into analysis tools. Date range filters are essential—people need to easily switch between yesterday, last week, last month, last quarter, and last year. Segment filters let people view data for specific customer types, product categories, or regions without building separate dashboards for everyone.
Drill-down functionality means clicking on a data point reveals more detail. Click on revenue to see which products contributed. Click on a product to see which customers bought it. Click on a customer to see their purchase history. This layered approach keeps main dashboards simple while making deeper analysis available on demand.
Alerts and automated notifications turn dashboards from passive reports into active management tools. Set threshold alerts for metrics that indicate problems—if inventory drops below a certain level, send an alert. If customer churn spikes above normal ranges, send an alert. Schedule automated reports so key dashboards email to your team at regular intervals. Just be careful not to over-alert because if people get 20 notifications daily, they’ll start ignoring all of them.
Your first dashboard design won’t be perfect and that’s completely fine. Get something functional up quickly, then refine based on how your team actually uses it. After two weeks, schedule a feedback session with the people who use dashboards most. Ask what’s helpful, what’s confusing, what’s missing, and what they never look at. Real-world experience reveals insights you couldn’t predict.
Check which visualizations people spend time on and which they ignore. Most platforms track user interactions with dashboards. If nobody ever clicks on a certain chart, either it’s not useful or it’s not clear what it shows. Fix it or remove it.
Common setup mistakes kill dashboard adoption before it starts. Building dashboards that answer questions nobody is asking wastes effort—every visualization should connect to a specific decision or action. Making dashboards too complicated drives people away—simplicity beats comprehensiveness every time. Ignoring mobile access loses engagement because people check numbers on phones constantly. Treating setup as a one-time project instead of an ongoing process lets dashboards become stale and irrelevant.
The step-by-step process for actually building and configuring dashboards properly makes the difference between analytics that get used daily and expensive software that sits idle. Our complete walkthrough of how to set up ERP analytics dashboards that drive revenue covers every technical detail from data connections through visualization choices to testing and iteration.
Leveraging real-time analytics for competitive advantage
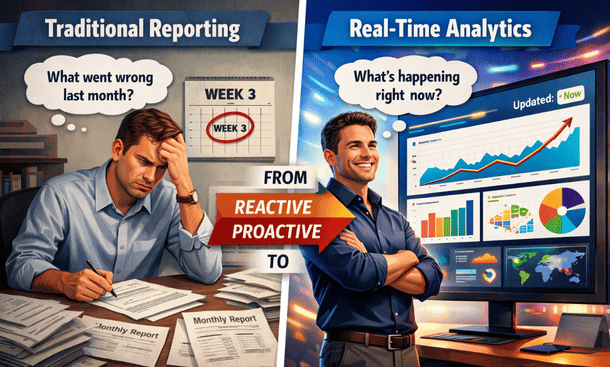
The gap between companies using delayed reporting and those with real-time analytics is widening every quarter, and honestly, that gap represents the difference between reacting to problems after they’ve compounded and catching them while you can still do something about it. Traditional monthly reports tell you what went wrong three weeks ago. Real-time dashboards show you what’s happening right now while there’s still time to fix it or capitalize on it.
Real-time analytics means your dashboards update within seconds or minutes of transactions occurring. Someone places an order and your revenue dashboard ticks up immediately. A customer support ticket gets resolved and your service metrics update instantly. Inventory moves and the system reflects it before you’ve finished scanning the barcode. This immediate visibility fundamentally changes how you manage your business.
The confusion around real-time often comes from marketing hype where vendors call anything faster than daily updates “real-time.” True real-time means updates within seconds. Near real-time usually means every few minutes with batched processing. Fast batch processing happens every hour or so. All of these beat daily or weekly reporting, but the differences matter depending on your business needs.
The question isn’t whether you need microsecond updates. It’s whether the delay between something happening and you knowing about it creates missed opportunities or unmanaged risks. That determines how real-time you actually need to be.
E-commerce businesses get massive value from real-time data because conversion rates, traffic patterns, and product performance change throughout the day. A San Jose founder I know used to review sales every Monday based on the previous week’s data. After switching to real-time dashboards, they noticed an abandoned cart spike on mobile one Tuesday afternoon. Within an hour they’d identified a checkout bug affecting certain phone models and pushed a fix that same day. The old system would have let that bug kill conversions for an entire week before anyone noticed.
That’s the power of instant visibility. You’re not just seeing what happened—you’re seeing what’s happening right now while you still have time to act. Real-time analytics turns reactive management into proactive management.
SaaS companies with usage-based pricing or freemium models need real-time user engagement data. Which features are people using right now? Where are they getting stuck? Who just hit usage limits and might upgrade? These insights lose value fast if you’re looking at them days later. Catching friction points immediately and reaching out to struggling users in the moment dramatically improves activation and retention.
Manufacturing and distribution operations benefit hugely from real-time supply chain visibility. Knowing exactly where inventory is, what’s being produced, and what’s being shipped lets you respond to disruptions immediately instead of discovering problems after commitments have been missed. Supply chains have too many moving parts to manage effectively with delayed data.
Service businesses with high customer interaction volume need real-time customer satisfaction and operational metrics. Average response times, ticket backlogs, customer sentiment, and resource utilization all require immediate attention when they start trending the wrong way. Service level agreements often have hourly requirements that you simply cannot manage to with yesterday’s data.
Building the infrastructure for real-time analytics requires more than just flipping a switch in your software. Your data sources need to support real-time streaming through APIs or database change feeds rather than batch exports that run overnight. Your analytics platform needs to handle high-frequency data ingestion without performance issues. Your dashboards need to auto-refresh without requiring manual page reloads.
The good news is that modern cloud-based analytics platforms handle most of this infrastructure automatically. You’re not building real-time data pipelines from scratch unless you have very specific or complex requirements. The platforms have evolved to where real-time capabilities are increasingly standard rather than premium add-ons.
Not every metric needs real-time updates though, and understanding which ones actually benefit from instant visibility helps you prioritize implementation and avoid unnecessary complexity. Cash position and daily cash flow should always be real-time if possible because running out of cash is an existential threat. Real-time visibility into receivables, payables, and bank balances gives you the runway to take action before crises hit.
Customer-facing issues like website uptime, page load speeds, and checkout completion rates need immediate monitoring. Every minute your site is slow or broken represents lost revenue. Real-time alerts let you address problems before they become disasters that affect hundreds or thousands of customers.
Inventory levels for high-velocity products should update continuously. Stockouts kill momentum and disappoint customers. Overstocks tie up cash and create storage problems. Real-time inventory visibility lets you maintain that sweet spot where you have enough stock to meet demand without excessive capital tied up in inventory.
Marketing campaign performance during active promotions needs real-time tracking. If your ads are crushing it, you want to increase spend today while momentum is hot, not next week after you’ve missed the opportunity. If they’re tanking, you want to pause them immediately before wasting more budget on something that isn’t working.
The real power of real-time analytics comes from automated alerts and responses that notify you when attention is needed and sometimes even take corrective action without human intervention. Threshold alerts are the foundation—you define acceptable ranges for critical metrics and the system alerts you when something falls outside those bounds.
Anomaly detection uses machine learning to identify unusual patterns even when they don’t cross pre-defined thresholds. Maybe revenue is within normal ranges but the mix of products selling is weird. Maybe customer support tickets are at normal volumes but sentiment is unusually negative. These subtle signals often indicate problems before they show up in obvious metrics.
Escalation workflows ensure the right people get involved at the right time. A minor issue might just log to a dashboard. A moderate issue sends a Slack message to the team. A critical issue sends SMS alerts to managers and executives. You don’t want to be the founder who missed a major problem because the alert got buried in email.
Automated responses take this even further. When certain conditions trigger, the system can automatically take action. Inventory hits reorder point and the system generates a purchase order. Website performance degrades and the system scales up server capacity. Campaign hits daily budget limit and the system pauses ad spend. This automation handles routine decisions instantly while freeing you to focus on strategy.
Bay Area companies are using real-time analytics to gain concrete competitive advantages that show up in their bottom lines. An Oakland distribution company was constantly firefighting inventory issues until they implemented real-time tracking integrated with sales velocity metrics. Now the system predicts stockouts three days in advance and automatically generates reorder recommendations. Their stockout rate dropped from 12 percent to under 2 percent.
A San Francisco SaaS company discovered through real-time user behavior tracking that users who didn’t complete a specific setup step within their first hour were 80 percent more likely to churn. They built an automated system that triggers a helpful email and offers live chat within 45 minutes if that step isn’t completed. Their activation rate jumped 35 percent.
A San Jose e-commerce company uses real-time pricing analytics to adjust margins dynamically based on demand, competition, and inventory levels. When they spot a competitor running out of stock on a hot item, they can capitalize on increased demand within hours instead of days. This dynamic approach increased their gross margin by 4 percentage points without hurting conversion rates.
These aren’t massive enterprises with unlimited budgets. These are businesses with 20 to 200 employees who made smart investments in real-time analytics and saw measurable returns. The capability has become accessible to companies of any size willing to implement it thoughtfully.
The psychological impact of real-time visibility deserves attention too because it fundamentally changes how entrepreneurs engage with their businesses. When you only see data weekly or monthly, you develop a disconnected relationship with your numbers. They feel historical and abstract. When you see data updating in real-time, it becomes visceral and immediate. You start to understand cause and effect in ways that aren’t possible with delayed reporting.
Founders with real-time dashboards check them habitually because the data is engaging. It’s like watching a game in progress versus reading about it after it’s over. The real-time nature makes it interesting and relevant. This increased engagement leads to better business intuition as you see the immediate impact of your decisions reflected in the data.
The downside is that real-time visibility can become addictive in unhealthy ways. Some founders start obsessively checking dashboards dozens of times per day, which isn’t productive. The key is finding the balance between staying informed and staying focused on the work that actually moves the needle.
Cost considerations for real-time analytics typically run 20 to 50 percent higher than standard reporting due to the computational resources required for continuous processing and streaming data. The ROI calculation needs to focus on what real-time visibility enables. Can you catch problems hours or days earlier? What’s the cost of those problems if they go unaddressed? Can you capitalize on opportunities faster? What’s the value of those opportunities?
For operations-heavy businesses, ROI often comes from efficiency improvements like reduced stockouts, optimized inventory levels, and improved resource utilization. For customer-facing businesses, it shows up in improved customer experience metrics that translate into higher retention and lifetime value. For most companies that implement it properly, preventing just one or two major issues per quarter makes the investment worthwhile.
The detailed look at how leading California companies are implementing and benefiting from instant visibility into their operations provides concrete examples and implementation strategies. Our deep dive on real-time ERP analytics and how Bay Area companies make faster business decisions covers the technical requirements, strategic applications, and ROI calculations that make real-time capabilities a competitive necessity rather than a luxury.
Avoiding expensive implementation mistakes
Real talk—the gap between buying an analytics platform and actually getting value from it is where tens of thousands of dollars disappear into thin air for California entrepreneurs every year. These aren’t complicated technical failures or unavoidable risks. They’re strategic mistakes that happen before you even log into the dashboard, and understanding them saves you a ridiculous amount of money, time, and stress.
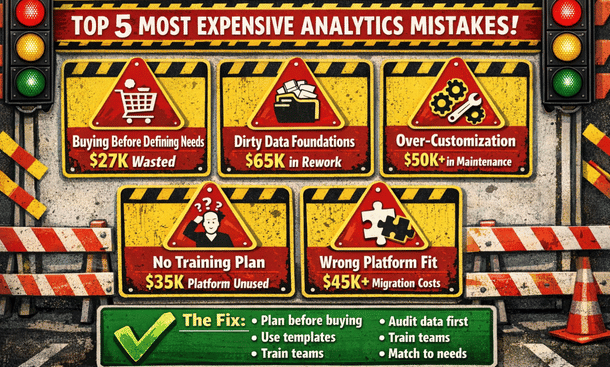
The most expensive mistake is buying software before defining your questions. Founders get excited about ERP analytics, sit through slick demos, read impressive case studies, and sign contracts without ever clearly articulating what business questions they need to answer. Six months later they’ve got a powerful tool that nobody uses because the team doesn’t know what to do with it.
The right approach flips this completely. Before you talk to a single vendor, list the ten most important questions you need answers to run your business better. What products are actually profitable after all costs? Which customer segments have the highest lifetime value? Where are we losing deals in the sales process? What’s our real cash runway? These questions become your requirements for evaluating platforms.
A Berkeley founder almost bought a $30K annual subscription before doing this exercise. When she got clear on her actual needs, she realized a $300 monthly tool could answer all her critical questions. She saved $27K in year one by defining requirements first instead of getting dazzled by features she’d never use.
Implementing without clean data foundations is the second killer. Your source systems probably have duplicate customer records, inconsistent product categorizations, incomplete transaction histories, and countless other data quality issues. When you connect analytics platforms to messy data, those problems get amplified. You end up with dashboards showing contradictory information, reports that don’t match your accounting system, and metrics that nobody trusts.
The insidious part is discovering these issues after you’ve paid for the platform and invested weeks in setup. Then you’re faced with either doing painful data cleanup that should have happened first or living with unreliable analytics that nobody will use. Before connecting any analytics platform to your systems, do a thorough data audit. Pull reports from each system and look for obvious issues. Are customer names consistent? Do product SKUs match across systems? Are transactions recording all required fields?
A San Francisco retail company spent $40K on an analytics implementation that failed because their inventory system had years of inconsistent data. Products were categorized differently over time, SKUs had been reused, and location codes didn’t match across stores. They spent another $25K on data cleanup before getting useful insights. That entire nightmare could have been avoided with an upfront audit that would have taken a few days.
Over-customization trips up companies that get seductive about building elaborate custom reports capturing every nuance of their unique business. Every custom dashboard you build is something you have to maintain. When business processes change, when you upgrade software, when you add new products, those custom reports break and need updating. You’re creating technical debt that compounds over time.
Start with standard reports and templates that come with your platform. These are built on best practices from thousands of implementations. They work out of the box, the vendor maintains them, and they often surface insights you wouldn’t have thought to look for on your own. Use standard reports for 80 percent of your needs, then customize only the 20 percent where your business truly requires something unique.
Companies spend $50K on custom dashboard development when standard templates would have served them perfectly. Worse, those custom dashboards become increasingly difficult to maintain as the business evolves, eventually requiring complete rebuilds. The maintenance costs over two or three years often exceed the original development investment.
Skipping training and change management dooms implementations even when the technical setup is flawless. You can build the most beautiful, powerful analytics system but if your team doesn’t know how to use it or doesn’t want to use it, you’ve built an expensive paperweight. The technical implementation is honestly the easy part. The hard part is changing how people work.
Your sales team needs to start checking dashboards instead of asking for reports. Your operations manager needs to trust the system’s numbers. Your CFO needs to use the platform for financial reviews instead of exporting to Excel. This behavioral change doesn’t happen automatically. It requires structured training sessions, ongoing support, regular office hours for questions, and clear expectations from leadership.
A San Diego company spent $35K implementing an analytics platform that sat unused for eight months because nobody trained the team. By the time they brought in a trainer and did proper change management, half the team had already decided the system wasn’t useful and were resistant to adopting it. The training that would have cost $3K upfront ended up costing $8K later plus months of lost productivity.
Choosing platforms based on features instead of fit wastes money because every platform has an impressive list of capabilities. Advanced AI, machine learning, hundreds of integrations, mobile apps, collaboration tools—the list goes on. The mistake is choosing based on who has the longest feature list rather than who fits your specific situation.
A platform with 500 integrations is useless if it doesn’t integrate with the five systems you actually use. Advanced machine learning is cool but irrelevant if you don’t have the data volume or use cases to leverage it. What matters is the match between what the platform does well and what you need most. Talk to businesses similar to yours in size, industry, and technical sophistication. What are they using? What do they wish they’d known before choosing?
Ignoring mobile accessibility seems like a small oversight until it kills your adoption rates. Modern entrepreneurs live on mobile devices. You’re checking business metrics while grabbing coffee, during your commute, between meetings, waiting for appointments. If your analytics platform requires you to be at a desk with a large monitor, you’re dramatically limiting when and how people engage with the data.
A Los Angeles founder told me they almost never used their expensive analytics platform because it required logging into a desktop application. Once they switched to a cloud platform with a solid mobile app, their engagement increased tenfold and they started catching issues and opportunities they’d been missing. When evaluating platforms, test the mobile experience thoroughly. Can you view critical dashboards on a phone? Are they readable without constant zooming? Do alerts work on mobile?
Building dashboards for everyone instead of roles creates information overload that reduces usefulness. When you’re excited about analytics, it’s tempting to create a comprehensive master dashboard showing everything to everyone. Your sales manager doesn’t need detailed inventory metrics. Your warehouse manager doesn’t need customer acquisition cost breakdowns. When people have to wade through irrelevant information to find what matters to them, they stop looking.
Build role-specific dashboards that show each person exactly what they need to do their job well. Sales dashboards focus on pipeline, conversions, and quota attainment. Operations dashboards track fulfillment, quality, and efficiency. Finance dashboards monitor cash, expenses, and profitability. This doesn’t mean completely siloing information, but the organization and emphasis should match the primary audience.
Treating analytics as a one-time project instead of an ongoing practice leads to systems that become outdated and irrelevant within months. Companies go through an intense setup phase, celebrate the launch, and then move on to other priorities. Six months later, dashboards show outdated metrics and nobody’s maintaining the system. Analytics is not a project with an end date. It’s an ongoing capability that needs continuous attention.
Assign clear ownership for analytics maintenance. Someone needs to be responsible for keeping dashboards current, adding new metrics as needed, troubleshooting issues, and ensuring the system continues delivering value. Schedule quarterly reviews of your analytics setup. What’s working well? What’s not being used? What new questions do we need to answer? These regular check-ins keep your analytics aligned with your business needs.
Neglecting data security and compliance can be the most expensive mistake of all because the costs show up as legal problems, compliance violations, or security breaches. When you connect an analytics platform to your business systems, you’re creating new pathways for sensitive data to flow. Customer information, financial records, employee data, and proprietary business metrics all become accessible through the analytics system.
Basic security measures that companies often skip include enforcing strong authentication, requiring VPN access for remote users, encrypting data at rest and in transit, and regularly reviewing who has access to what data. If you handle payment card data, HIPAA-regulated health information, or EU customer data covered by GDPR, your analytics system needs to comply with those regulations. Violations aren’t just expensive fines—they damage your reputation and customer trust.
A healthcare startup chose an analytics platform without verifying HIPAA compliance. They invested $45K in implementation before discovering during an audit that the platform didn’t meet requirements. They had to scrap everything and start over with a compliant solution. That mistake cost them six months and nearly $70K total.
Measuring vanity metrics instead of actionable KPIs fills dashboards with numbers that feel important but don’t actually drive decisions. Total registered users sounds impressive but doesn’t tell you much about business health. What matters is active users, engaged users, paying users. Total revenue is important but gross profit and net profit matter more. Website traffic is nice but conversion rate impacts your bottom line.
Before adding any metric to your dashboard, ask what decision this metric informs or what action a change would trigger. If you can’t answer clearly, it’s probably a vanity metric cluttering your dashboard without adding value. Actionable KPIs connect directly to business outcomes, they’re specific and measurable with clear definitions, and changes suggest specific actions you should take.
The hidden costs of poor analytics implementations extend beyond wasted software spending. Opportunity cost is huge—while you’re struggling with a bad setup, you’re missing insights that could grow your business. Competitors with better analytics are making faster, smarter decisions and pulling ahead. Team morale suffers when implementations fail, people lose confidence in data-driven decision making, and they become resistant to future initiatives.
Bad data leading to bad decisions can be catastrophically expensive. If your analytics tell you a product line is profitable when it’s actually losing money, you might invest heavily in scaling something that’s dragging down your entire business. The time cost of manual workarounds adds up when analytics systems don’t work and people build spreadsheets and create informal processes to get the information they need.
Creating a practical framework helps you avoid these traps. Before buying, list your top business questions, verify platform integrations with your existing systems, test mobile experiences thoroughly, check security and compliance requirements, and talk to similar businesses about their experiences. During implementation, clean source data first, start with standard reports, create role-specific dashboards, plan formal training, assign maintenance ownership, and define actionable KPIs with appropriate security controls.
After launch, schedule quarterly reviews to assess what’s working, budget for continuous improvement, monitor adoption rates and address resistance, keep dashboards updated as priorities change, and measure ROI based on better decisions and time saved. This checklist won’t guarantee success but it will dramatically reduce your risk of expensive mistakes.
Understanding these pitfalls in depth with specific examples of what goes wrong and how to prevent it protects your investment and ensures your analytics implementation delivers the ROI you’re expecting. The comprehensive breakdown of ERP analytics mistakes that cost California businesses $50K and how to avoid them provides detailed prevention strategies and recovery plans if you’ve already made some of these mistakes.
Building a sustainable analytics practice
Getting your ERP analytics implementation launched successfully represents just the beginning of the journey, not the destination. The companies that extract real value from their analytics investments are the ones that treat it as an ongoing practice rather than a completed project. This shift in mindset separates analytics implementations that deliver compounding returns over years from those that deliver a brief spike of value before fading into irrelevance.
The core principle is that your business changes constantly and your analytics need to evolve alongside it. The metrics that mattered when you had ten customers aren’t the same ones that matter when you have a thousand. The dashboards that helped you survive early-stage chaos need to adapt as you build more mature operations. The questions you needed to answer last quarter get replaced by new questions as you grow and face different challenges.
Establishing clear ownership and governance prevents analytics from becoming everyone’s responsibility, which in practice means nobody’s responsibility. Designate someone as your analytics owner—this doesn’t have to be a full-time role but it needs to be an explicit part of someone’s job. This person maintains dashboards, troubleshoots issues, onboards new team members, evaluates whether the current setup still serves your needs, and champions data-driven decision making across the organization.
For smaller companies, this might be your operations manager or controller who spends a few hours weekly on analytics. For larger organizations, you might have a dedicated business intelligence analyst. The title matters less than having someone who wakes up feeling accountable for whether your analytics are working well.
Governance policies prevent the chaos that emerges when everyone starts building their own dashboards and defining metrics differently. Establish clear guidelines about who can create dashboards, how metrics get defined, what data can be accessed by different roles, and how changes to dashboards get requested and approved. This doesn’t mean being rigid or bureaucratic—it means having enough structure that your analytics environment doesn’t become an unmaintainable mess.
Metric definitions deserve special attention because ambiguity here creates confusion and bad decisions. What exactly counts as an active user? How do you calculate customer lifetime value? What expenses get included in calculating profit margins? Document these definitions clearly and make sure everyone uses the same calculations. When your sales dashboard and your finance dashboard show different revenue numbers because they’re calculated differently, people stop trusting any of the numbers.
Scheduled reviews keep your analytics aligned with your evolving business. Quarterly reviews work well for most companies—frequent enough to catch drift before it becomes a problem but not so frequent that they become burdensome. During these reviews, evaluate what’s working, what dashboards get used versus ignored, what new questions you need to answer, what data sources you should add, and whether your current platform still fits your needs.
These reviews also surface opportunities to level up your analytics maturity. Maybe you started with basic descriptive analytics showing what happened. As you get comfortable with that, you can add diagnostic analytics that explain why things happened. Eventually you might implement predictive analytics that forecast what’s likely to happen next. This progression from simple to sophisticated happens naturally over time if you’re regularly assessing and improving.
Training needs continue well beyond the initial implementation. New employees join who need onboarding to your analytics systems. Existing employees need refreshers on features they’re not using. Platform updates introduce new capabilities that require training. Advanced users might want deeper training on complex features. Building a culture where people continuously improve their analytics skills pays dividends in better decision making across the organization.
Create a library of training resources that people can access on demand. Short video tutorials showing how to perform common tasks. Written guides with screenshots for building specific types of dashboards. Recordings of past training sessions that new hires can watch. FAQ documents addressing common questions. This library reduces the burden on your analytics owner because people can find answers themselves instead of always asking for help.
Regular office hours or drop-in sessions where team members can ask questions and get help create ongoing support without requiring scheduled appointments. Maybe your analytics owner holds office hours every Tuesday and Thursday from 2 to 3 pm where anyone can drop by with questions. This low-friction support mechanism catches small issues before they become big problems and helps people unlock value from features they’re not using effectively.
Celebrating wins and sharing insights builds momentum and engagement. When someone discovers something valuable in the analytics, make sure the whole team hears about it. Maybe you have a weekly standup where people share interesting findings. Maybe you have a Slack channel dedicated to analytics insights. Maybe you highlight a different dashboard or metric each week. This celebration reinforces that analytics matter and encourages people to engage more deeply.
The human side of analytics often gets overlooked but it matters as much as the technical side. Some people naturally gravitate toward data and love diving into dashboards. Others find it intimidating or prefer qualitative information. Your job is to make analytics accessible and valuable for everyone, not just the data enthusiasts. That means building dashboards that match different comfort levels, providing support that meets people where they are, and being patient as people develop their data literacy.
Resistance to analytics usually comes from fear rather than stubbornness. People worry that metrics will be used to judge them unfairly, that they’ll look stupid if they don’t understand the data, or that analytics will reveal problems that reflect poorly on them. Address these concerns directly by emphasizing that analytics exist to help everyone make better decisions, not to create gotcha moments or assign blame. When problems surface in the data, frame them as opportunities for improvement rather than failures.
Budget planning for analytics needs to account for ongoing costs beyond the initial implementation. Platform subscriptions typically renew annually with potential price increases. You’ll likely add users as you grow. New integrations might require paid connectors or middleware tools. Advanced features might sit behind higher pricing tiers that make sense to unlock as your needs evolve. Training and consulting costs continue as you tackle more sophisticated use cases.
Plan for analytics spending to scale roughly with your business growth. A rule of thumb is that analytics should cost between half a percent and two percent of revenue, depending on how data-intensive your business model is. E-commerce and SaaS companies tend toward the higher end because data is core to their operations. Service businesses might be on the lower end because they have fewer data points to track.
The ROI of analytics spending should be measured against the value of better decisions and the cost of problems avoided. This is inherently difficult to quantify precisely, but you can estimate it. If better inventory analytics prevent a stockout that would have cost $10K in lost sales, that’s measurable value. If cash flow visibility lets you negotiate better terms with a vendor because you can commit earlier, that’s real savings. If customer analytics help you focus marketing spend on high-value segments and improve your CAC by 15 percent, that’s tangible ROI.
Integration expansion happens naturally as your business adds new systems and tools. Every time you adopt new software, ask whether it should connect to your analytics platform. Your e-commerce company adds a new payment processor—should transaction data feed into your dashboards? You start using a customer service platform—should ticket data integrate with your customer analytics? You implement a marketing automation tool—should campaign performance flow into your marketing dashboards?
Not every new tool needs to integrate immediately, but having a deliberate process for evaluating integrations ensures you’re building a comprehensive view of your business rather than creating data silos. The cost and effort of adding integrations should be weighed against the value of having that data available for analysis.
Data quality maintenance requires ongoing attention because data decay happens naturally over time. Customer information becomes outdated. Product categorizations drift. New data entry processes introduce inconsistencies. Schedule regular data quality audits—maybe twice a year—where you check for duplicates, verify that categories and tags are being used consistently, confirm that required fields are being filled out, and generally ensure your data stays clean.
Automated data quality checks help catch issues early. Many platforms can flag potential problems like duplicate records, missing required fields, or values that fall outside expected ranges. Setting up these automated checks during implementation and monitoring them regularly prevents data quality from degrading slowly over time.
Platform evaluation should happen periodically to ensure you’re still using the right tool. Technology evolves, new platforms emerge with better capabilities, pricing models change, and your own needs shift as you grow. Every two to three years, do a brief evaluation of whether your current platform still serves you well or whether it’s worth considering alternatives.
This doesn’t mean constantly switching platforms, which is disruptive and expensive. It means staying aware of what’s available and making informed decisions about whether the pain of switching would be worth the benefits of a better solution. Sometimes you discover your current platform is still the best option. Sometimes you find that new capabilities or better pricing elsewhere justify making a change.
Scaling analytics maturity over time follows a natural progression that you can accelerate with intentional effort. Most companies start with descriptive analytics—dashboards showing what happened with your revenue, customers, operations, and finances. This foundational layer needs to work well before moving forward.
Diagnostic analytics come next, helping you understand why things happened the way they did. This involves more sophisticated segmentation, correlation analysis, and cohort studies. Why did revenue drop in week three? Why is customer segment A more profitable than segment B? Why did that marketing campaign underperform? Answering these why questions requires digging deeper into your data.
Predictive analytics use historical patterns to forecast what’s likely to happen next. Machine learning models can predict which customers are likely to churn, which leads are most likely to convert, what inventory levels you’ll need next month, or how much cash you’ll have in 60 days. This level of analytics provides enormous value but requires clean historical data and some technical sophistication.
Prescriptive analytics go furthest by not just predicting outcomes but recommending specific actions. The system might suggest optimal pricing for different products, recommend which marketing channels to invest in based on expected ROI, or propose inventory reordering strategies that minimize both stockouts and overstock. Few small businesses reach this level but it represents the cutting edge of what’s possible.
Building a data-driven culture is the ultimate goal and the hardest part of sustainable analytics practice. It means that when people face decisions, their instinct is to look at what the data says rather than relying purely on intuition. It means people feel comfortable saying “I don’t know, let me check the data” rather than guessing. It means data gets brought into conversations naturally rather than being an afterthought.
This cultural shift happens slowly and requires consistent leadership modeling. When executives make decisions, they should reference the data that informed their thinking. When meetings happen, relevant dashboards should be pulled up and discussed. When debates arise, data should be invited into the conversation as a neutral arbiter. Over time, these behaviors become normalized and the culture shifts.
The payoff for building a sustainable analytics practice compounds over years. Your decisions get progressively better as you accumulate more data and develop deeper insights. Your team becomes more sophisticated about using analytics, unlocking value from advanced features you couldn’t leverage initially. Your competitive advantage grows as you optimize based on insights that competitors without good analytics miss entirely.
Maintaining momentum requires treating analytics as a strategic capability that deserves ongoing investment and attention, not as a technical project that gets completed and forgotten. The companies dominating their markets ten years from now will be the ones that figured out how to turn data into systematic competitive advantages through disciplined, sustained analytics practices.
Turning insight into action
The difference between California entrepreneurs who scale successfully and those who plateau or struggle comes down to how well they understand what’s actually happening in their businesses. Flying blind worked when your operation was small enough to keep in your head. At any meaningful scale, you need systems that surface the insights hidden in your data and turn those insights into decisions that compound over time.
ERP analytics represents the systematic approach to understanding your business that separates amateurs from professionals. This isn’t about drowning in spreadsheets or becoming a data scientist. It’s about building dashboards that answer your most important questions, catching problems while they’re still small, spotting opportunities while there’s still time to capitalize, and making decisions based on evidence instead of hunches.
The path forward starts with getting clear on what questions you need answered. Write down the ten things you wish you knew about your business right now. Those questions become your requirements for choosing a platform. Don’t get seduced by feature lists or slick demos. Pick the tool that answers your questions at a price you can afford with an interface your team will actually use.
Implementation success comes from starting simple and expanding thoughtfully. Build three core dashboards that address your biggest priorities. Get those working smoothly. Train your team properly. Establish ownership and processes. Then layer on complexity gradually as you get comfortable with the foundations. Companies that try to boil the ocean on day one end up overwhelmed and abandon the effort. Companies that start focused build momentum and capabilities over time.
Real-time visibility transforms how you operate once you’ve got solid foundations in place. The ability to see what’s happening right now instead of what happened last week or last month changes everything about how you manage. You catch issues before they compound. You adjust strategies based on early signals. You operate with a level of responsiveness that competitors stuck in delayed reporting cycles simply cannot match.
Avoiding expensive mistakes protects your investment and ensures you actually get value from your analytics spending. Define your needs before buying. Clean your data before connecting it. Use standard templates before customizing. Train your team thoroughly. Choose platforms based on fit rather than features. Build role-specific dashboards instead of generic ones. Treat security and compliance seriously. Focus on actionable KPIs instead of vanity metrics.
The long-term value comes from building sustainable practices that evolve with your business. Assign clear ownership for maintaining your analytics. Schedule regular reviews to ensure your dashboards stay relevant. Keep training new users and helping existing ones level up. Celebrate insights and wins. Budget for ongoing investment. Build a culture where data informs decisions naturally instead of being an afterthought.
You’re at an inflection point where analytics capabilities that required enterprise resources five years ago are now accessible to any entrepreneur willing to implement them thoughtfully. That democratization creates both opportunity and pressure. The opportunity is that you can compete with bigger, better-funded competitors by being smarter with your data. The pressure is that your competitors have access to the same capabilities, so not leveraging analytics puts you at a real disadvantage.
The California startup ecosystem doesn’t reward second-place finishers. You’re competing for customers, talent, funding, and market position against companies that are leveraging every possible advantage. ERP analytics isn’t a nice-to-have anymore. It’s table stakes for serious entrepreneurs who want to build businesses that scale efficiently and sustainably.
Your next step depends on where you are in the journey. If you’re just getting started with analytics and need to build foundational understanding, going back to examine what ERP analytics is and why California startups need it ensures you’ve got the conceptual framework right. If you’re ready to move from insight to implementation and want to avoid the expensive mistakes that derail most analytics projects, the detailed breakdown of common pitfalls that cost businesses $50K and how to avoid them provides the protective knowledge that saves you from wasting money on implementation failures.
The entrepreneurs who win over the next decade will be the ones who figured out how to systematically turn data into better decisions, faster responses, and compounding competitive advantages. That capability doesn’t happen accidentally. It requires intentional investment in the right tools, thoughtful implementation, ongoing refinement, and building a culture where data informs how you operate. Everything in this guide gives you the roadmap. What you do with it determines whether you’re competing or just participating.
About the Author

mike
Mike is a tech enthusiast passionate about SaaS innovation and digital growth. He explores emerging technologies and helps businesses scale through smart software solutions.
Did you find this helpful?
Your feedback helps us curate better content for the community.